Tujuan Pembelajaran
📚 Pendahuluan
Apa itu Computer Vision & Object Detection?
Computer Vision adalah cabang artificial intelligence yang memungkinkan komputer untuk "melihat" dan memahami konten visual seperti gambar dan video. Object Detection adalah task spesifik dalam computer vision yang bertujuan untuk:
1. Localization: Menemukan posisi objek dalam gambar (bounding box)
2. Classification: Mengidentifikasi jenis/kelas objek
3. Confidence: Memberikan skor kepercayaan untuk setiap deteksi
Ground Penetrating Radar (GPR)
GPR adalah metode geofisika non-invasif yang menggunakan gelombang elektromagnetik untuk mencitrakan struktur bawah permukaan. Prinsip kerjanya:
- Transmisi: Antena transmitter memancarkan pulsa radar ke dalam tanah
- Refleksi: Sinyal dipantulkan oleh objek/interface dengan kontras dielektrik
- Penerimaan: Antena receiver menangkap sinyal reflected
- Imaging: Data ditampilkan sebagai radargram (x: posisi, y: kedalaman/waktu)
GPR Hyperbola: Signifikansi Geofisika
Ketika GPR melewati objek buried (pipa, kabel, rongga, batuan), reflected signal membentuk pola hyperbola pada radargram. Karakteristik hyperbola mengandung informasi penting:
- Apex (puncak) → Posisi horizontal dan kedalaman objek
- Curvature (kelengkungan) → Kecepatan propagasi gelombang dalam medium
- Width (lebar) → Ukuran dan sifat objek
- Amplitude (intensitas) → Kontras material properties
Kenapa Deep Learning untuk GPR?
✗ Time-consuming untuk dataset besar (ratusan/ribuan profile)
✗ Subjektif - hasil bervariasi antar interpreter
✗ Sulit membedakan hyperbola dari noise/artifacts
✗ Tidak scalable untuk real-time monitoring
✓ Deteksi otomatis dan konsisten
✓ Cepat - ribuan images dalam hitungan menit
✓ Dapat belajar pattern kompleks dari data
✓ Scalable untuk monitoring continuous
🚀 Roboflow Platform Overview
Roboflow adalah platform end-to-end untuk computer vision yang memungkinkan workflow tanpa coding:
Fitur Utama Roboflow
🔧 Workflow: Step-by-Step Tutorial
FASE 1: Setup & Dataset Acquisition
- Buka browser dan navigate ke
https://roboflow.com - Klik tombol "Sign Up" di pojok kanan atas
- Pilih metode sign up:
- Sign up dengan Google Account (recommended - lebih cepat), atau
- Sign up dengan Email & Password
- Pilih plan: "Public Plan (Free)" - sudah cukup untuk pembelajaran
- Verify email jika diminta
- Complete profile setup (nama, role, use case)

• Unlimited public projects
• 10,000 source images
• Roboflow Train access
• Hosted API deployment
• Community support
- Setelah login, klik "Universe" di navigation bar atas
- Di search bar, ketik:
GPRataugpr hyperbola - Atau langsung buka URL:
https://universe.roboflow.com/gpr-uurq0/gpr-liosq - Review dataset page untuk melihat:
- Total images (train/val/test)
- Number of classes
- Example images dengan annotations
- Dataset health score
- Model benchmarks (jika ada)
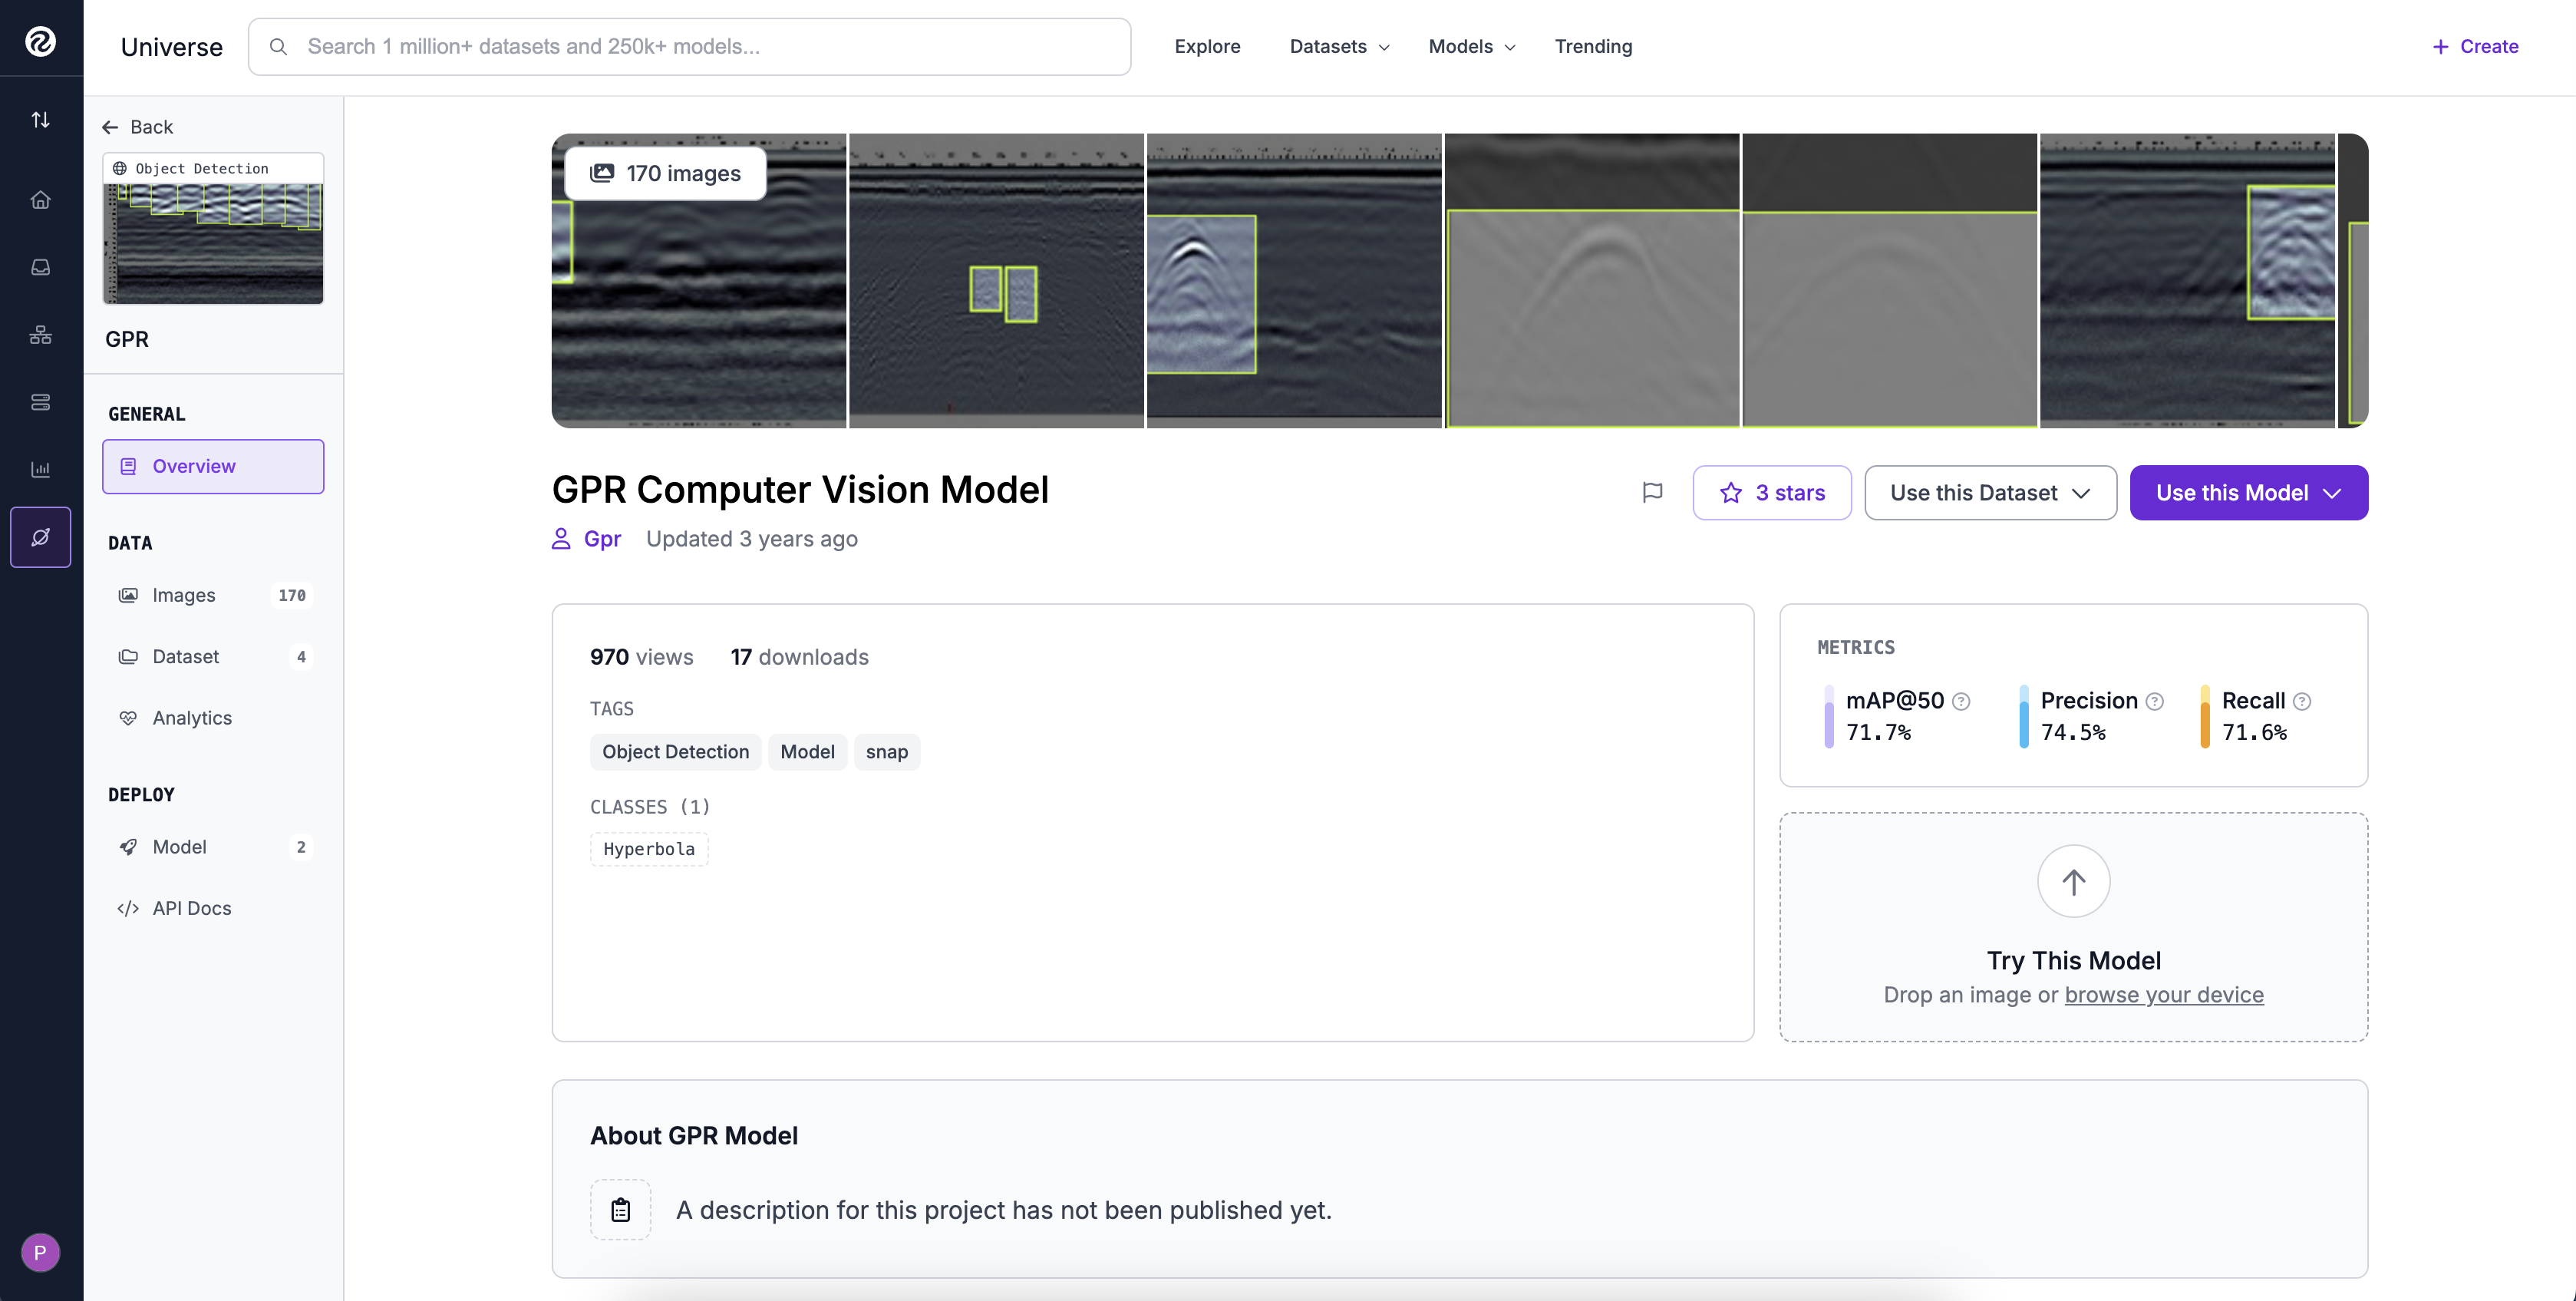
• Total images: [lihat di dataset page]
• Classes: Biasanya 1 class - "hyperbola"
• Format: Object detection (bounding boxes)
• Health score: Indicator kualitas annotations
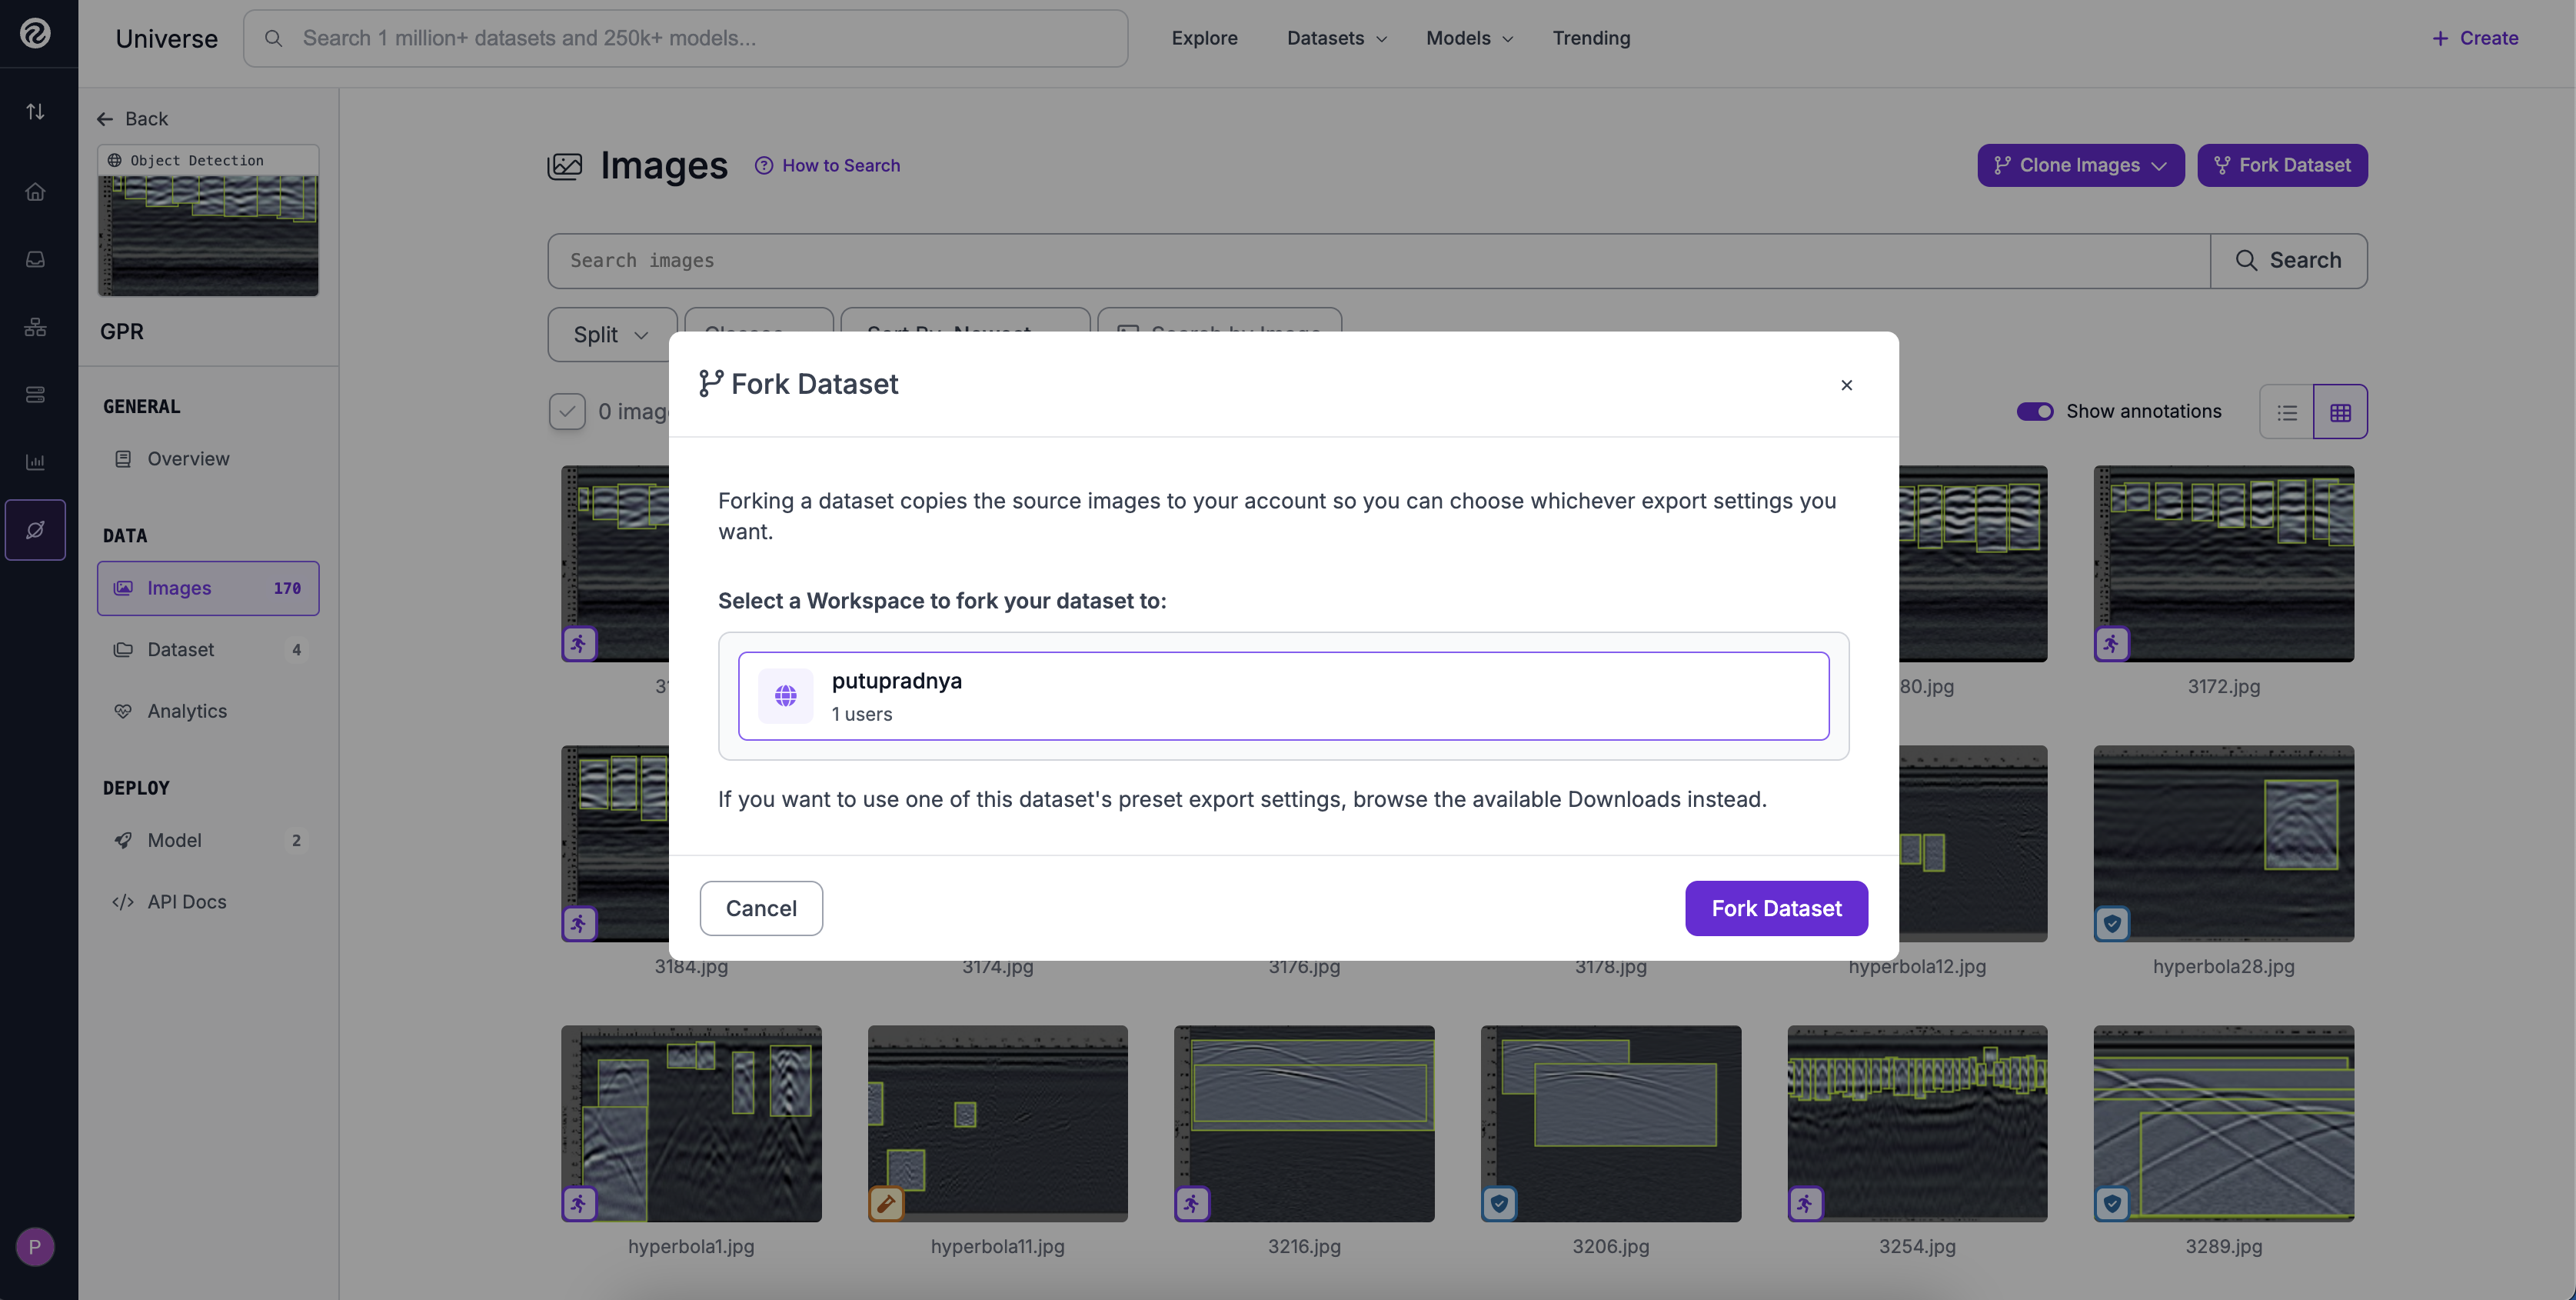
- Di halaman dataset GPR, scroll ke bawah dan cari tombol `Use this Dataset` lalu pilih "Fork Dataset"
- Pilih opsi "Fork to my workspace" (bukan download langsung)
- Dialog akan muncul, beri nama project:
GPR-Hyperbola-Detection - Pilih workspace (default: personal workspace)
- Klik "Create Project"
- Tunggu proses forking (1-3 menit)
- Dataset sekarang ada di workspace pribadi Anda!
Jika tombol "Fork" tidak ada:
1. Download dataset (YOLO format recommended)
2. Create new project di workspace
3. Upload images + annotations manually
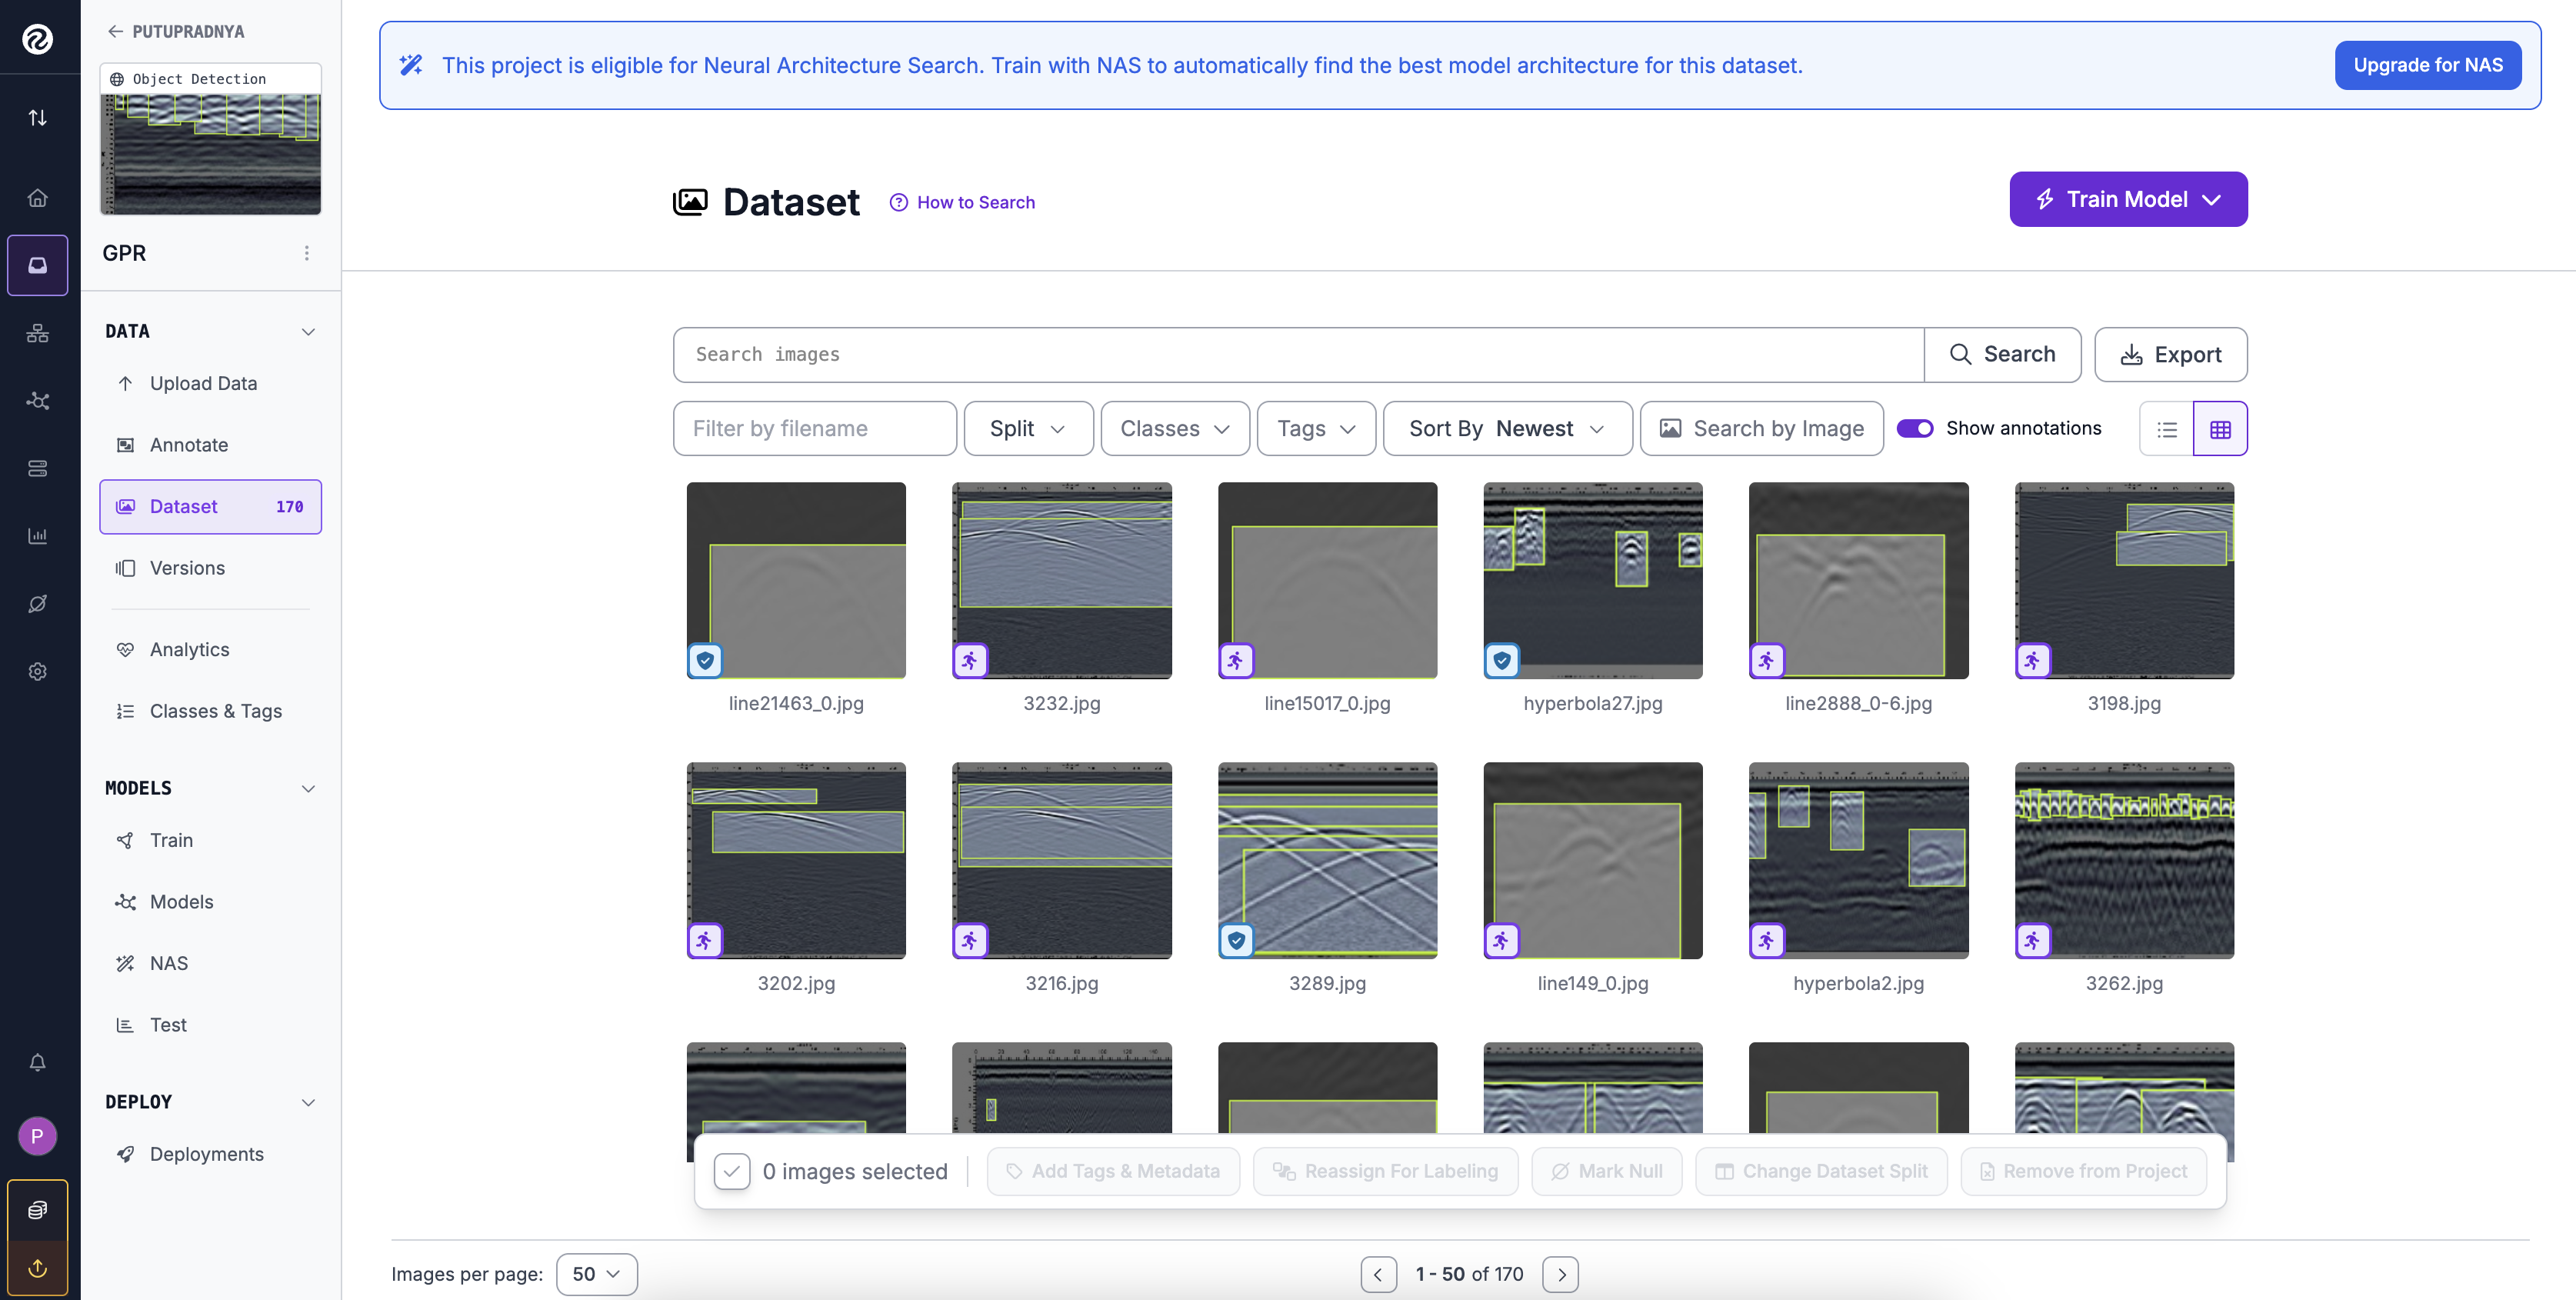
- Buka project "GPR-Hyperbola-Detection" dari workspace
- Tab "Dataset" - lihat overview:
- Total images
- Classes distribution
- Train/Val/Test split ratio
- Annotation statistics
- Tab "Images" - browse sample images:
- Click image untuk melihat detail
- Lihat bounding boxes (hyperbola annotations)
- Check annotation quality
- Tab "Health Check" - review dataset quality:
- Class balance
- Image size distribution
- Null annotations (images tanpa label)
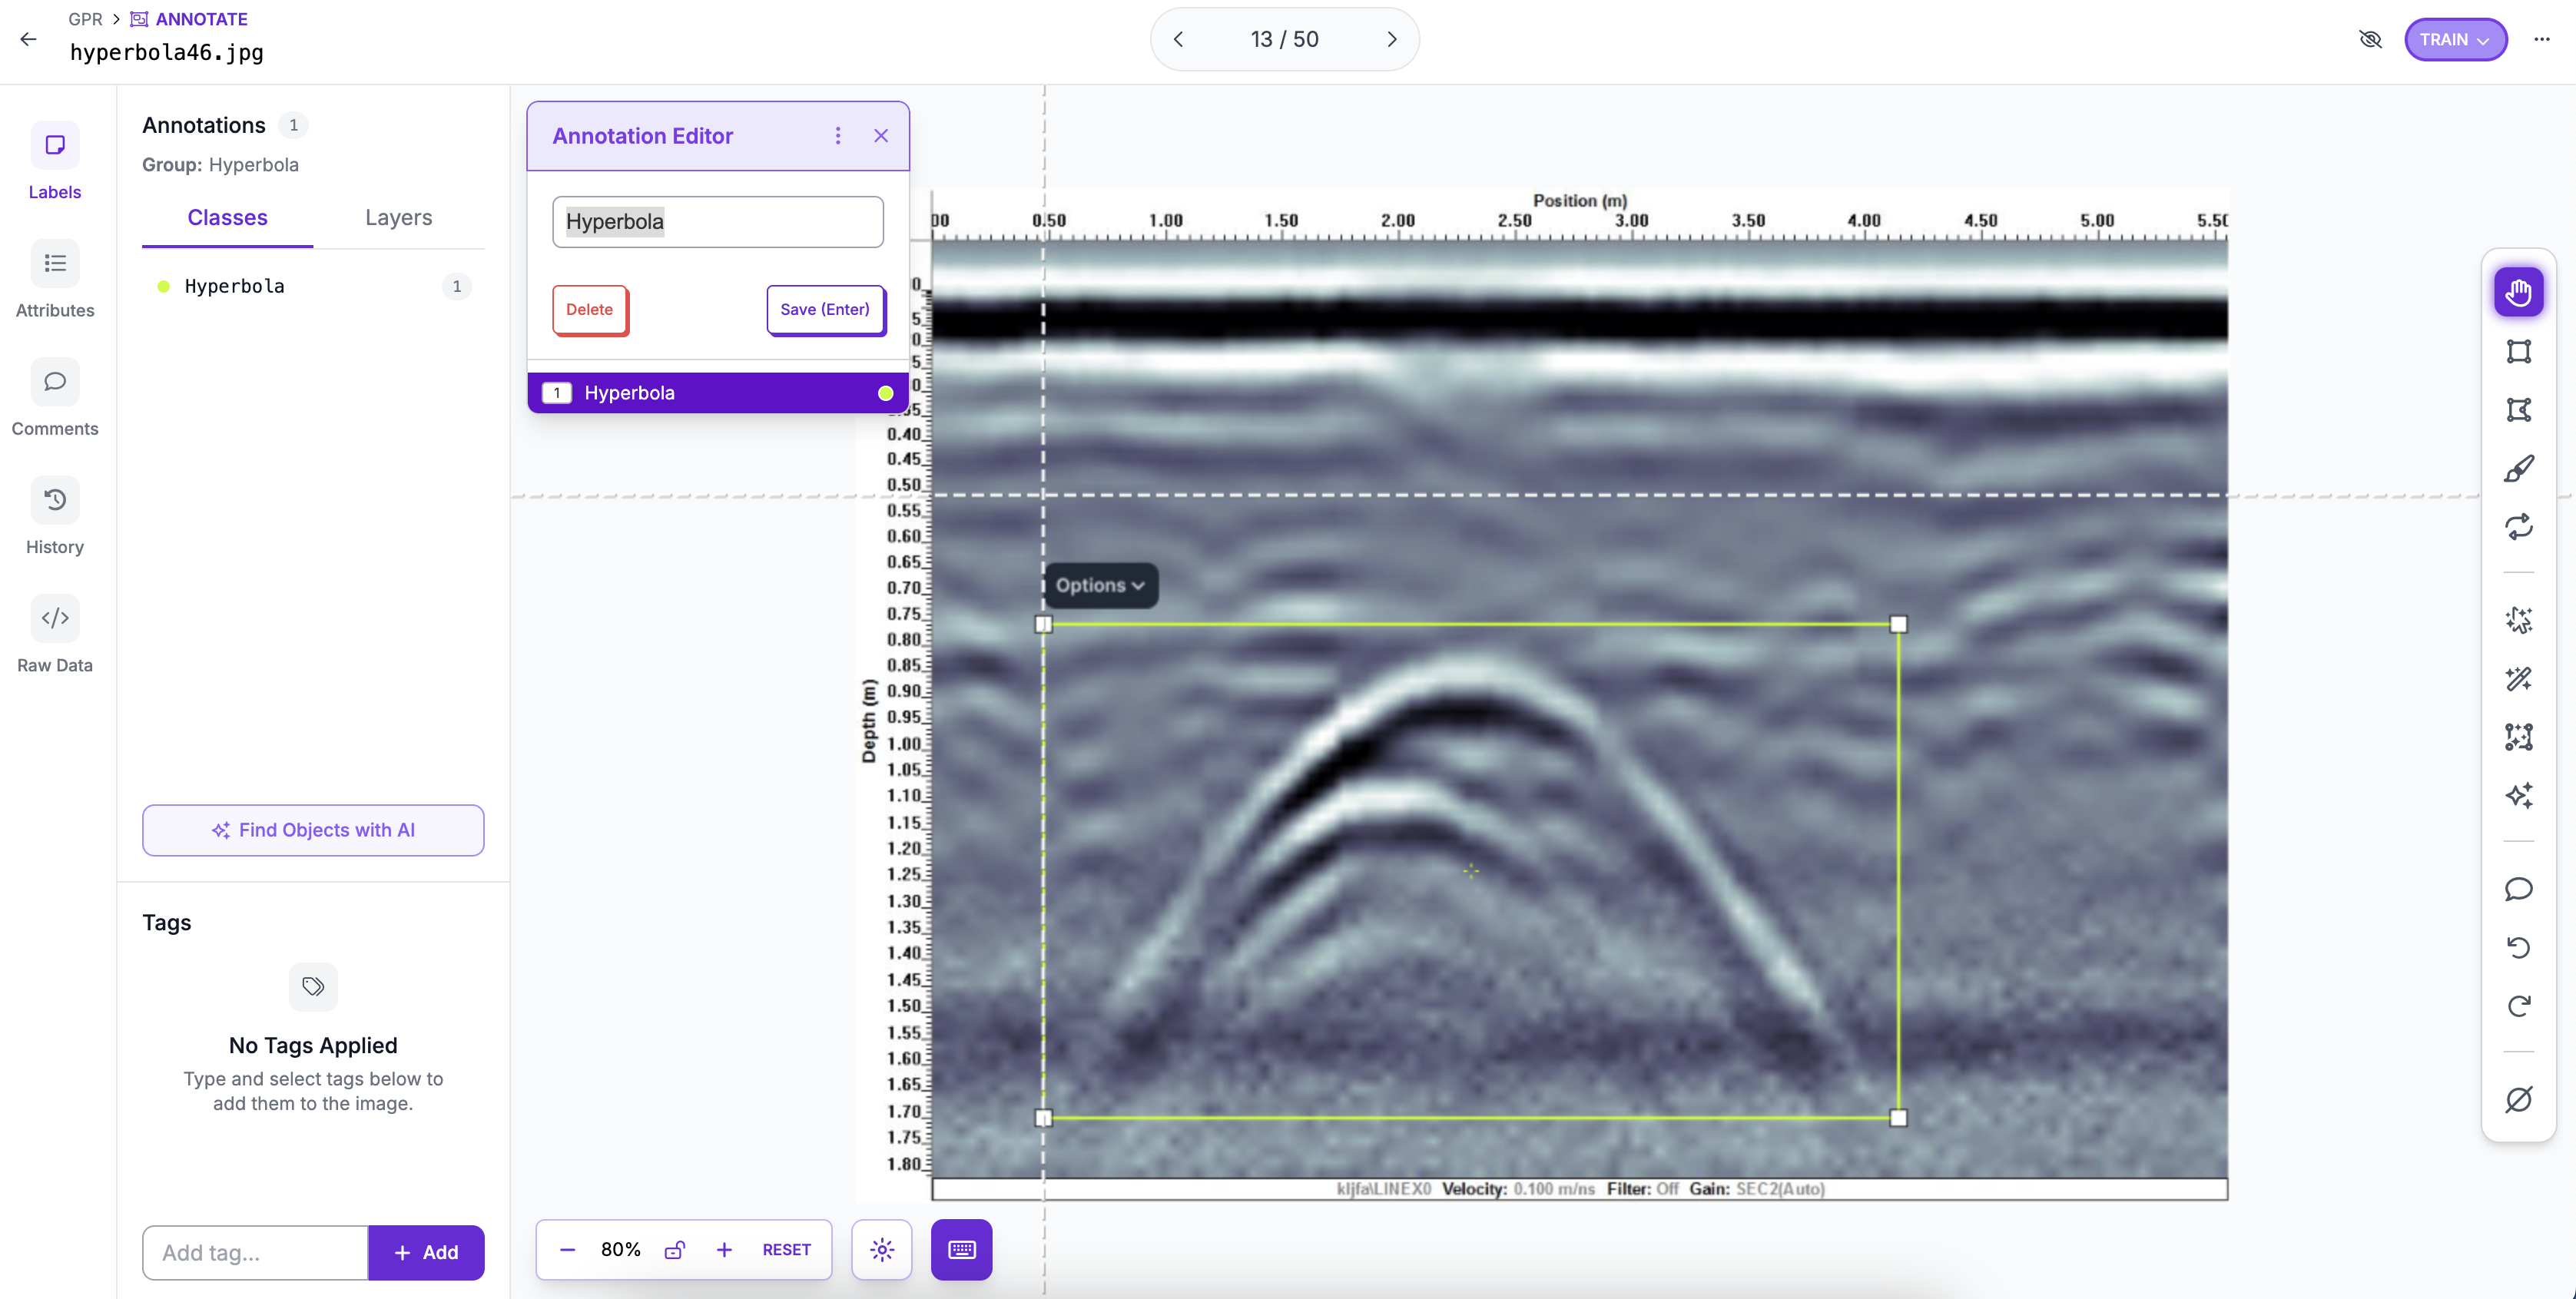
- Berapa rata-rata hyperbola per image?
- Apakah annotation quality konsisten?
- Apakah ada missing annotations (hyperbola tidak ter-label)?
- Variasi ukuran bounding boxes (small, medium, large objects)
- Image resolution - apakah seragam?
FASE 2: Data Preprocessing & Augmentation
- Di project dashboard, klik tombol "Generate"
- Atau klik "Versions" → "Create New Version"
- Halaman "Generate New Version" akan terbuka dengan 3 tabs:
- Preprocessing - transformasi images
- Augmentation - create variations
- Generate - finalize & create version
Preprocessing Settings
| Preprocessing | Setting | Alasan |
|---|---|---|
| Auto-Orient | ✅ ON | Fix image rotation berdasarkan EXIF metadata |
| Resize | ✅ 640 × 640 px | Standard input size untuk YOLO models (v11, v8, dll) |
| Resize Method | Stretch to Fit | Atau "Fit (letterbox)" untuk maintain aspect ratio |
| Grayscale | ❌ OFF | GPR sudah grayscale, tidak perlu konversi |
| Tile Images | ❌ OFF | Hanya untuk very large images (>2000px) |
| Contrast | ❌ OFF | Akan handle via augmentation |
Augmentation menciptakan variasi dari training images untuk improve model generalization. Klik tab "Augmentation" untuk configure.
| Augmentation | Setting | Alasan |
|---|---|---|
| Flip Horizontal | ✅ ON | Hyperbola bisa muncul dari arah manapun |
| Flip Vertical | ❌ OFF | Orientasi vertical penting (depth ke bawah) |
| Rotation | ✅ ±10° to ±15° | GPR profile bisa sedikit miring saat acquisition |
| Crop | ❌ OFF | Bisa potong hyperbola, tidak disarankan |
| Brightness | ✅ ±15% to ±20% | GPR intensity bisa bervariasi |
| Exposure | ✅ ±10% to ±15% | Variasi kondisi acquisition |
| Blur | ✅ Up to 1.5px | Simulate noise/low resolution data |
| Noise | ✅ Up to 2% pixels | Realistic GPR data often has noise |
| Cutout | ❌ OFF | Bisa hide hyperbola features |
| Mosaic | ❌ OFF | Tidak cocok untuk GPR spatial continuity |
Jika dataset KECIL (<100 images): Pilih 3x multiplier
Jika dataset MEDIUM (100-500 images): Pilih 2x multiplier
Jika dataset BESAR (>500 images): Pilih None atau 2x
Augmentation multiplier = berapa kali augmented version dibuat per original image
- Klik tab "Generate" (tab terakhir)
- Review Preprocessing Summary dan Augmentation Summary
- Configure Dataset Split:
- Pastikan "Stratified split" ON (untuk balance class distribution)
- Review summary - estimasi total images setelah augmentation
- Klik tombol "Generate"
- Tunggu proses generate (1-5 menit tergantung ukuran dataset)
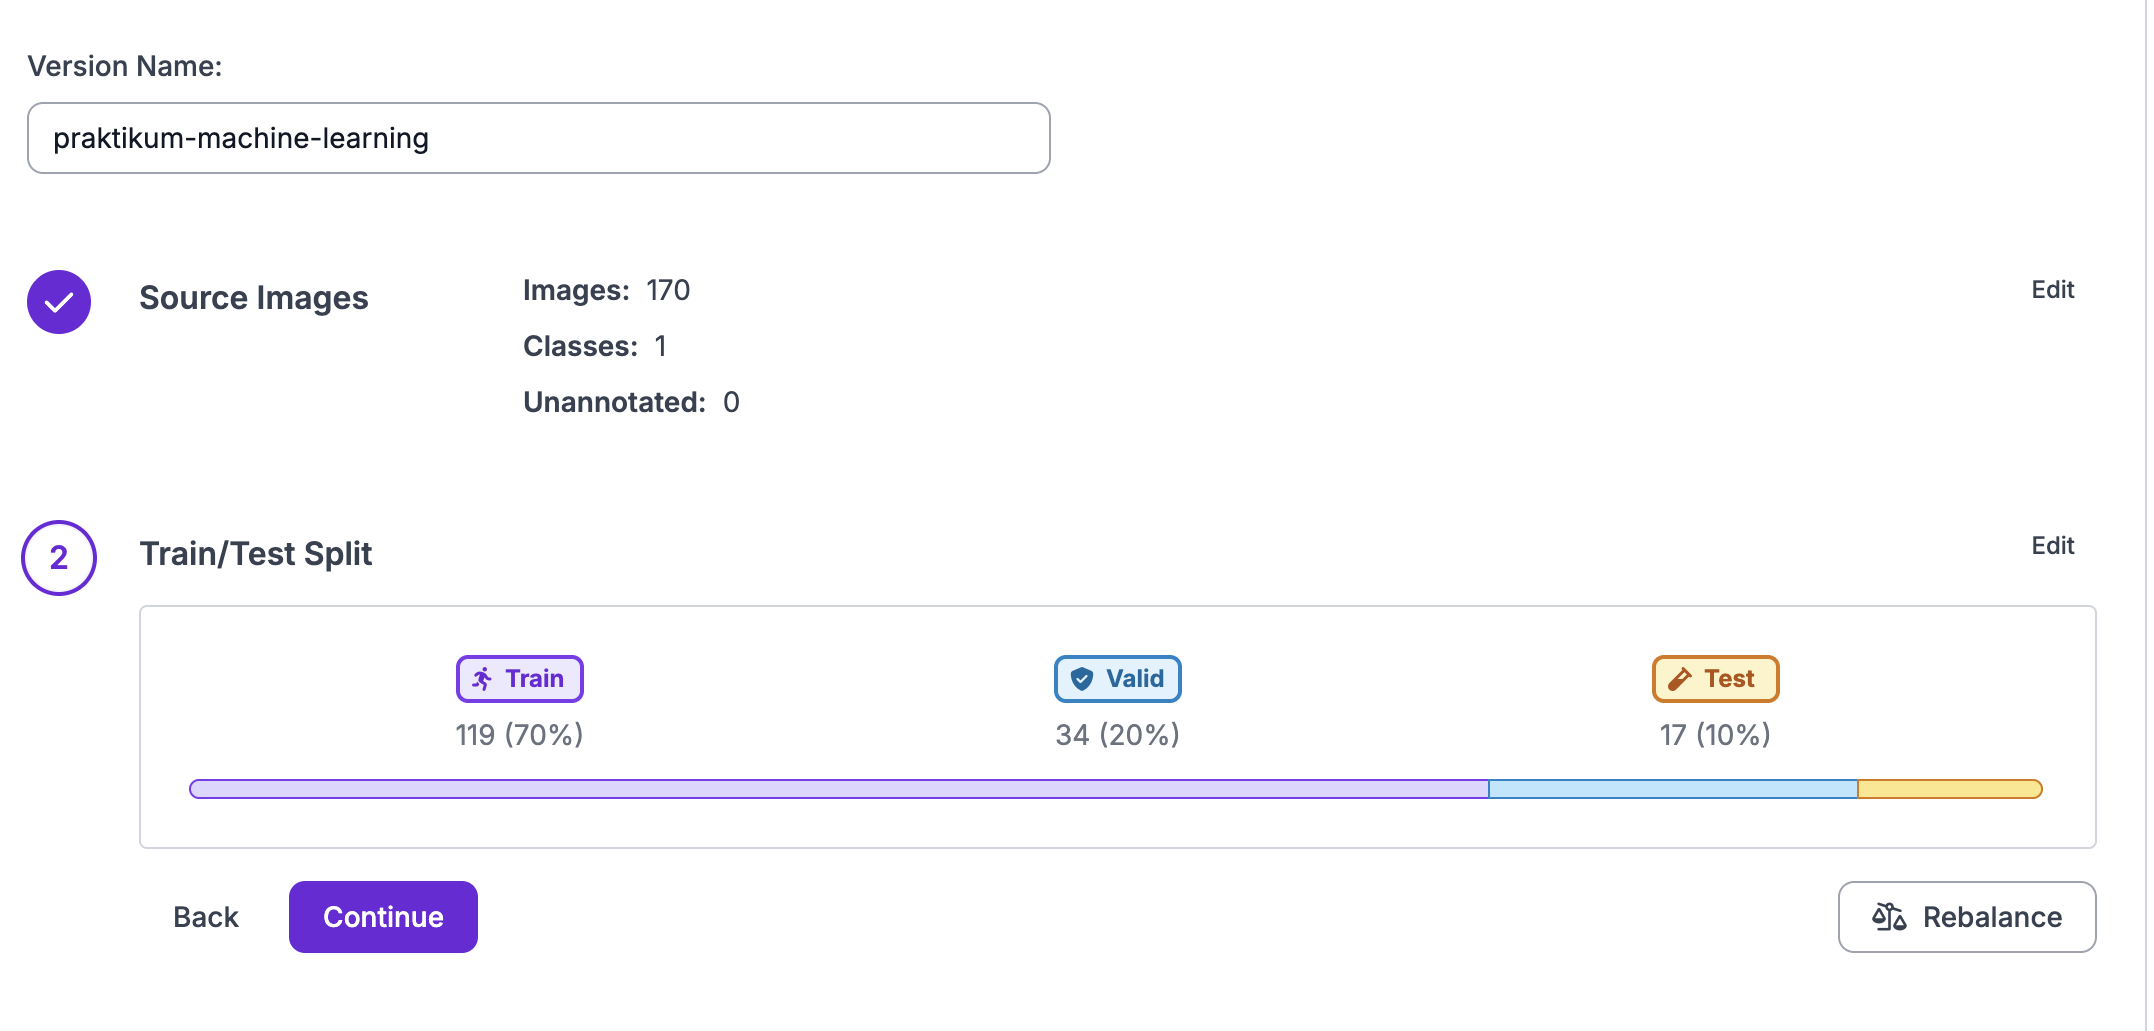
Setelah proses selesai, Anda akan memiliki:
• Version 1 (atau version berikutnya jika sudah ada versions sebelumnya)
• Preprocessing applied (resize, auto-orient)
• Augmentation applied (jika enabled)
• Train/Val/Test splits
• Ready untuk training!
FASE 3: Model Training
- Di dataset version yang baru dibuat (Version 1), klik tombol "Train with Roboflow"
- Pilih "Roboflow Train 3.0" (recommended - fastest & latest)
- Halaman training configuration akan terbuka
Model Selection
Untuk praktikum ini: Pilih YOLOv11 dengan Model Size: Nano
• Nano: ringan dan cepat, cocok untuk dataset learning
• Successor YOLOv8 dengan inference lebih efisien
• Jika hasil kurang memuaskan, upgrade ke size Small atau Medium
Training Configuration
- Select model: YOLOv11 → Model Size: Nano
- Training settings (biasanya auto-optimized):
- Epochs: 100 (dengan early stopping)
- Batch size: Auto (Roboflow optimize based on GPU)
- Image size: 640 × 640 (sesuai preprocessing)
- Optimizer: Adam (default)
- Klik tombol "Start Training"
- Training job akan masuk queue (biasanya instant jika free GPU available)
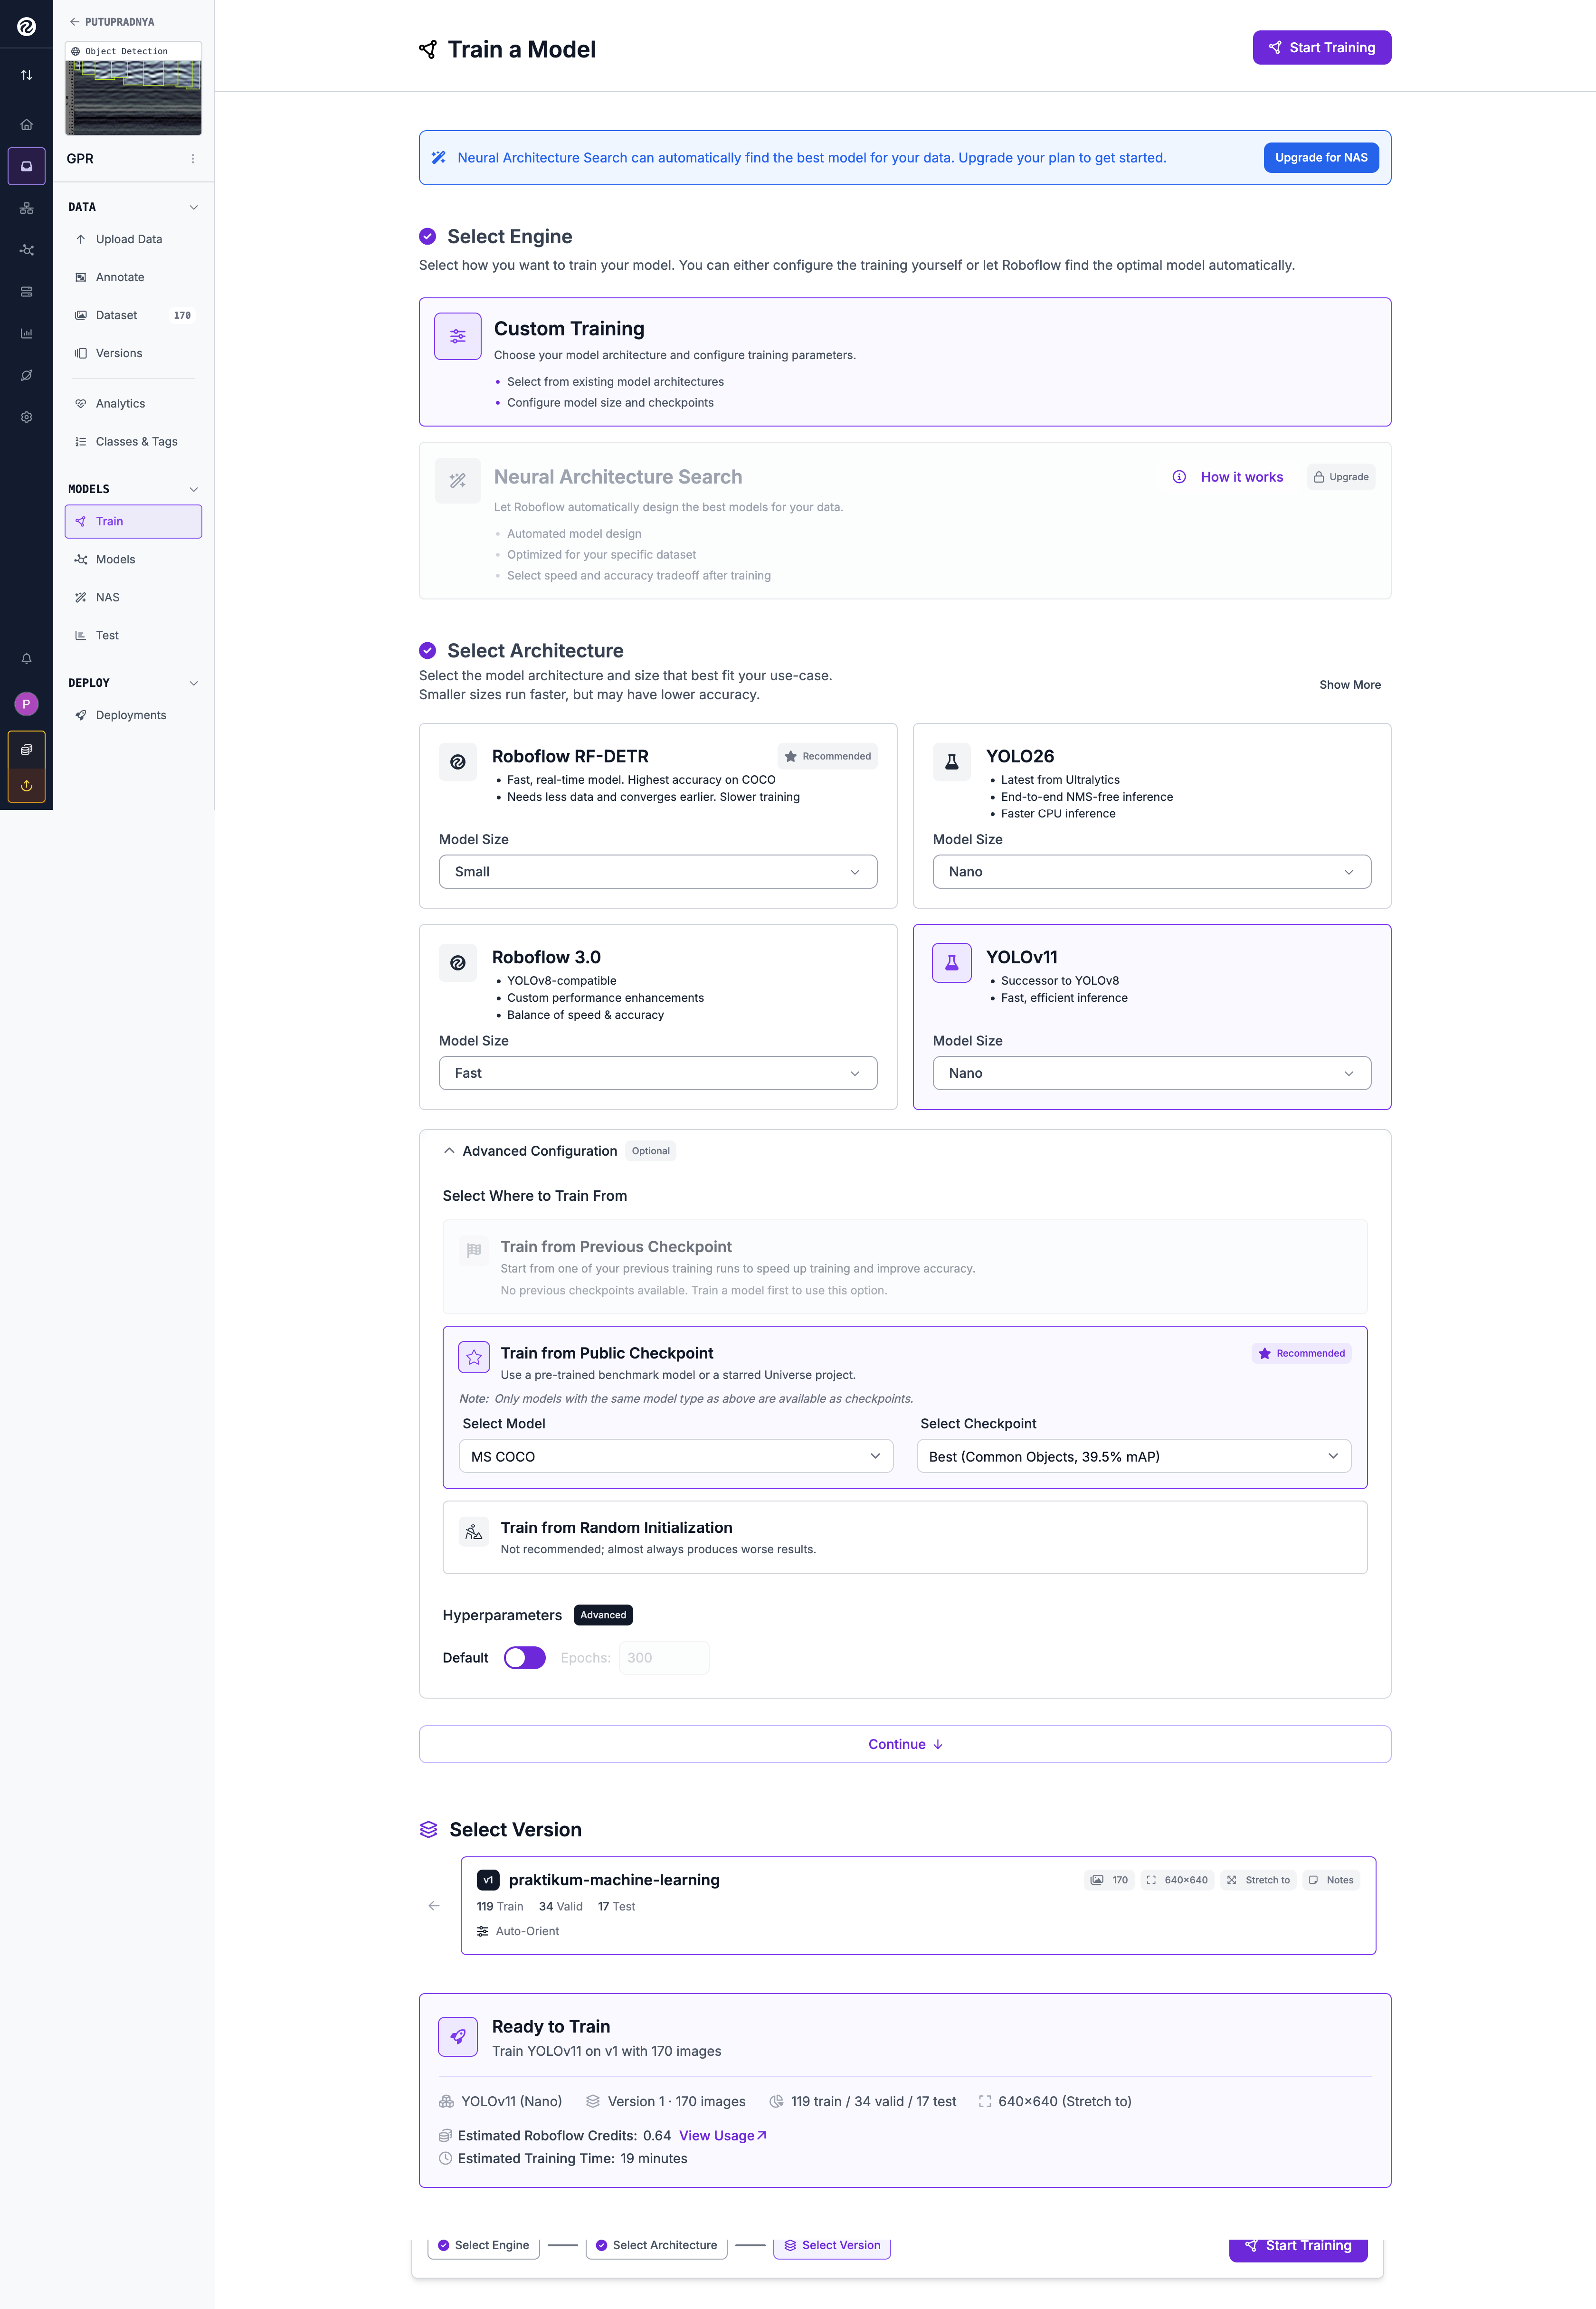
Small dataset (<100 images): ~5-10 menit
Medium dataset (100-500 images): ~10-20 menit
Large dataset (>500 images): ~20-40 menit
Note: Free plan menggunakan shared GPU, bisa ada waiting time
- Setelah training dimulai, Anda akan diredirect ke Training Dashboard
- Dashboard menampilkan real-time metrics:
- Loss curves (Box, Object, Class loss)
- Precision - seberapa akurat predictions
- Recall - seberapa banyak hyperbola terdeteksi
- mAP@0.5 - mean average precision at 50% IoU
- mAP@0.5:0.95 - average mAP across IoU thresholds
- Charts update setiap beberapa epochs
- Early stopping: Training otomatis berhenti jika validation loss tidak improve selama 10-15 epochs
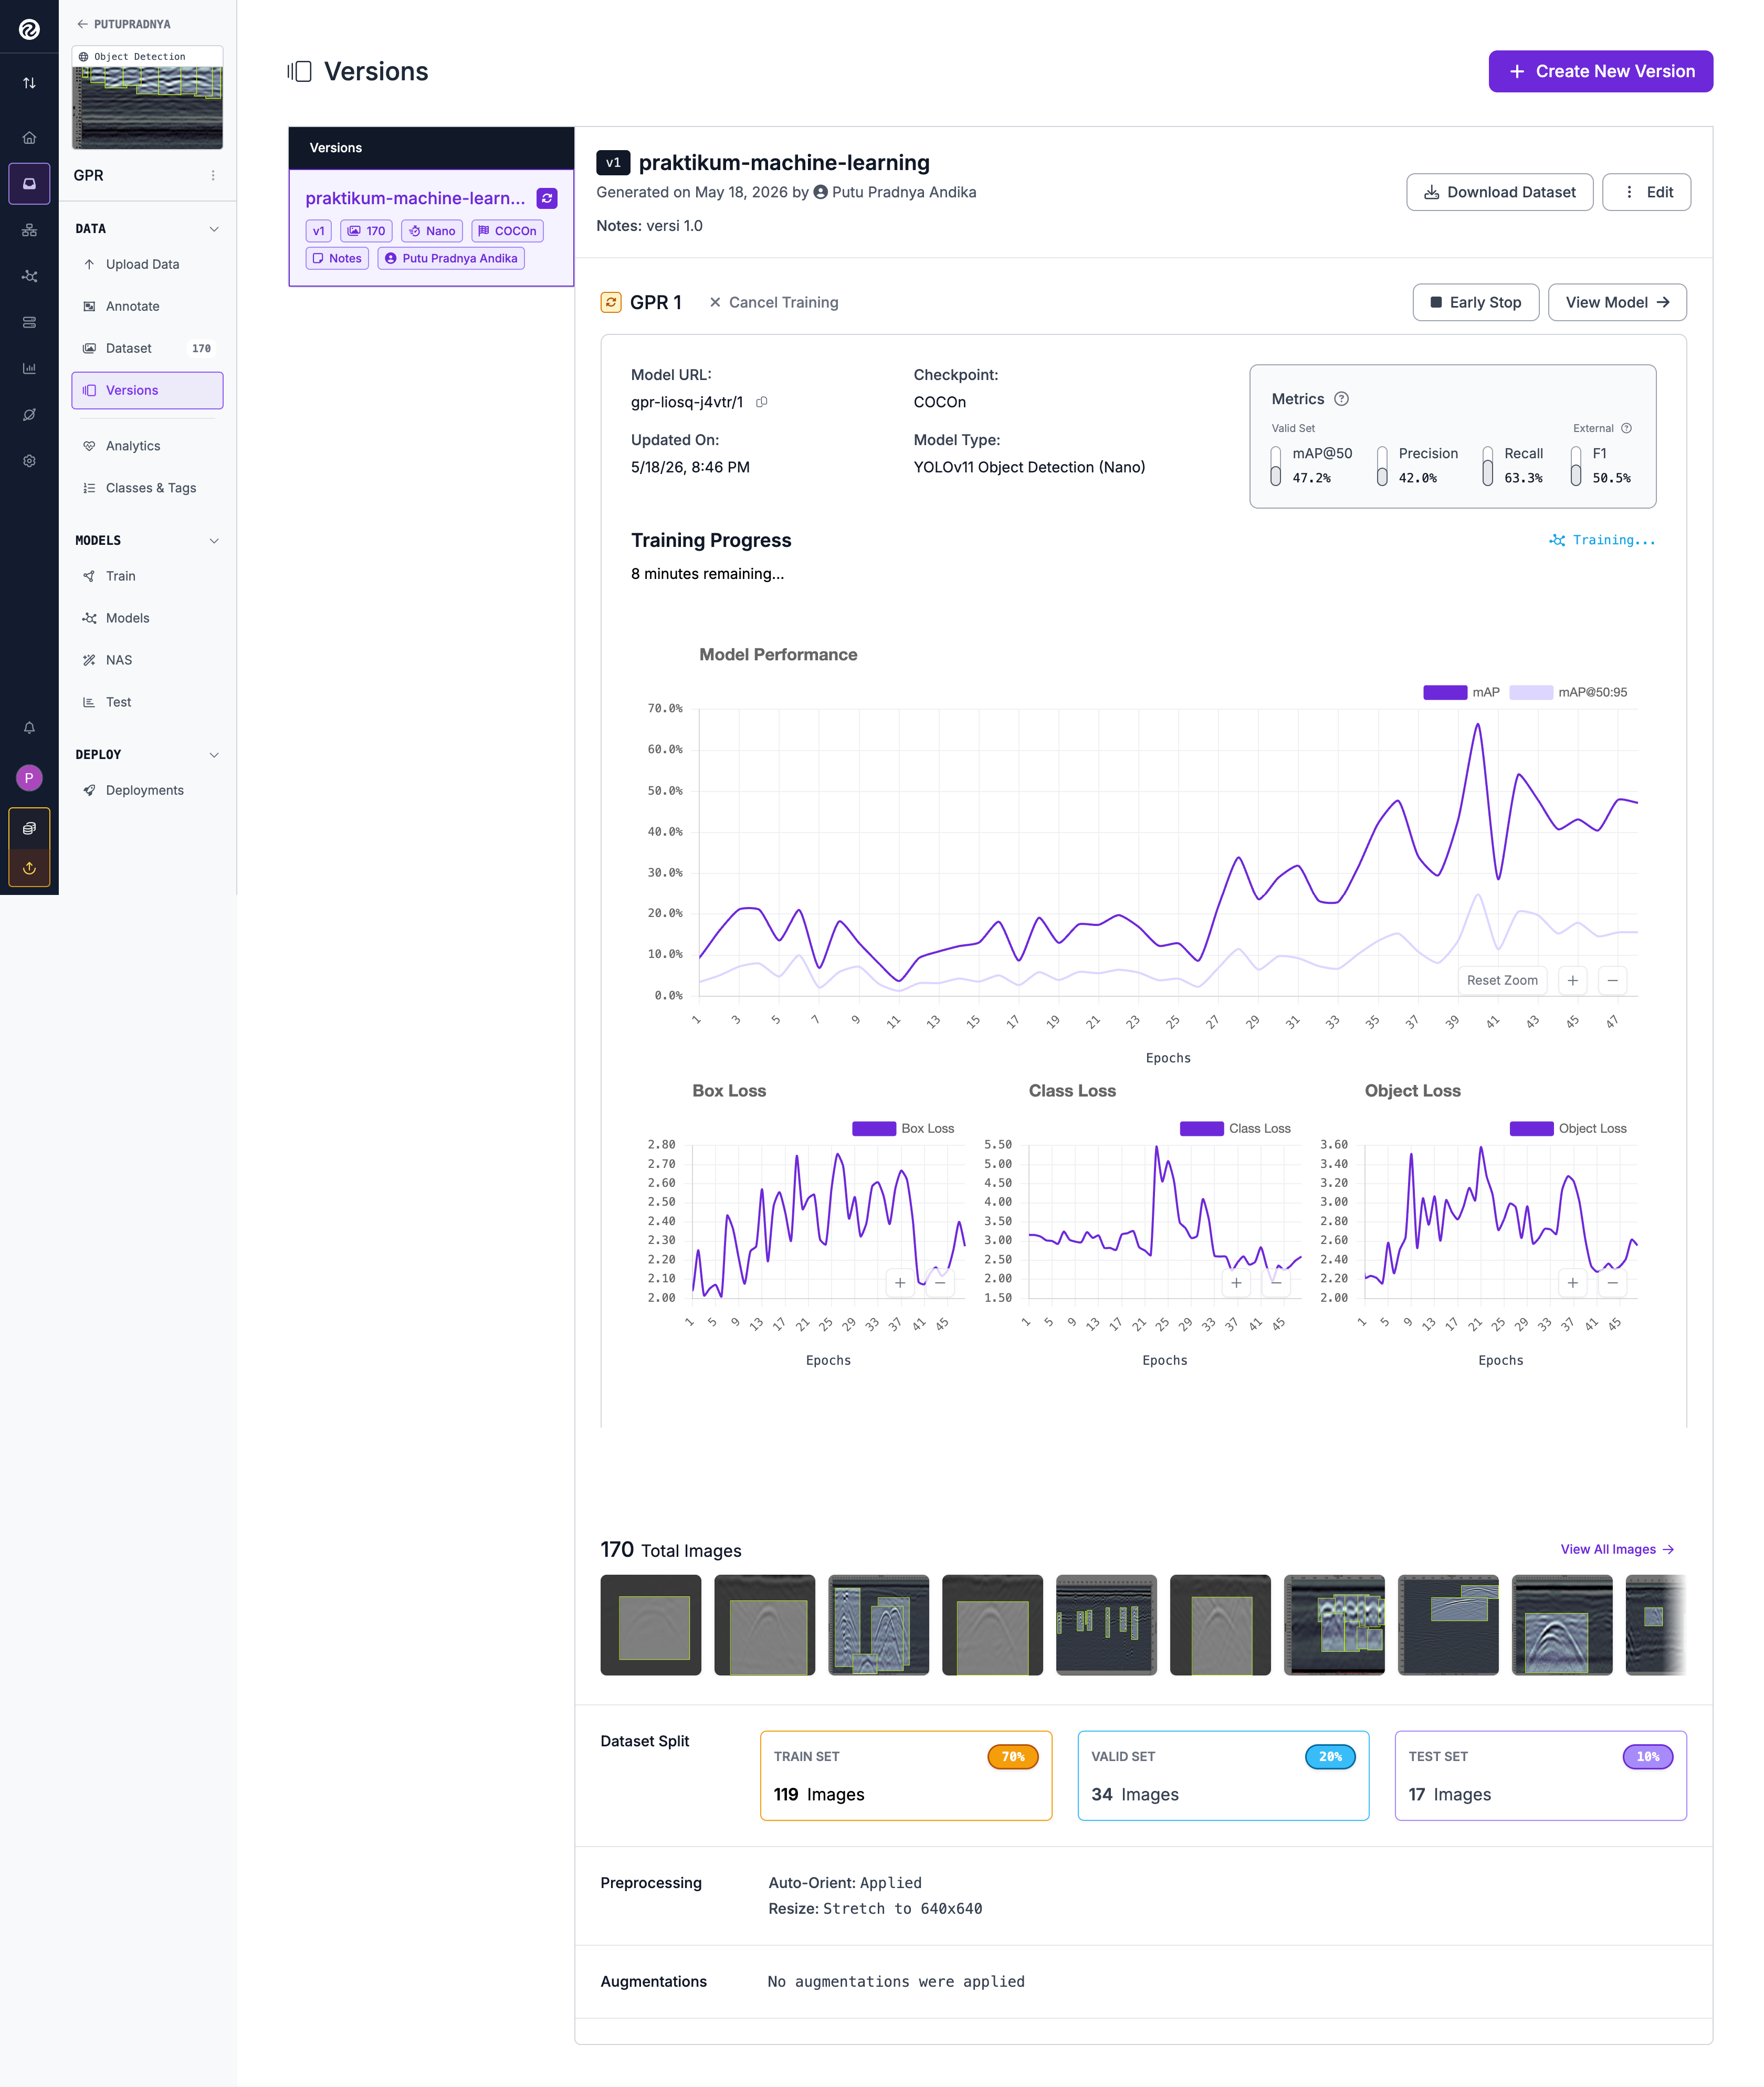
- Loss decreasing: Training berjalan baik
- Train & Val loss converging: Model generalizing well
- Precision & Recall increasing: Performance improving
- mAP increasing: Overall quality meningkat
- Loss stuck/plateau: Mungkin perlu learning rate adjustment
- Val loss increasing while train loss decreasing: Overfitting!
- Very low metrics (<50%): Dataset quality issue atau wrong model
FASE 4: Model Evaluation & Testing
- Setelah training selesai, tab "Results" akan menampilkan comprehensive metrics
- Review Metrics Summary:
• Precision ~78%: Dari semua deteksi yang dibuat, 78% benar → false positive masih ada tapi terkontrol
• Recall ~68%: 68% dari semua hyperbola berhasil terdeteksi → ada ~32% yang masih terlewat
• mAP@0.5 ~68%: Performa solid untuk model Nano pada dataset GPR
• mAP@0.5:0.95 ~32%: Wajar untuk Nano — metric ini sangat strict (lokalisasi presisi)
• Loss curves train & val keduanya menurun konsisten → tidak ada overfitting signifikan
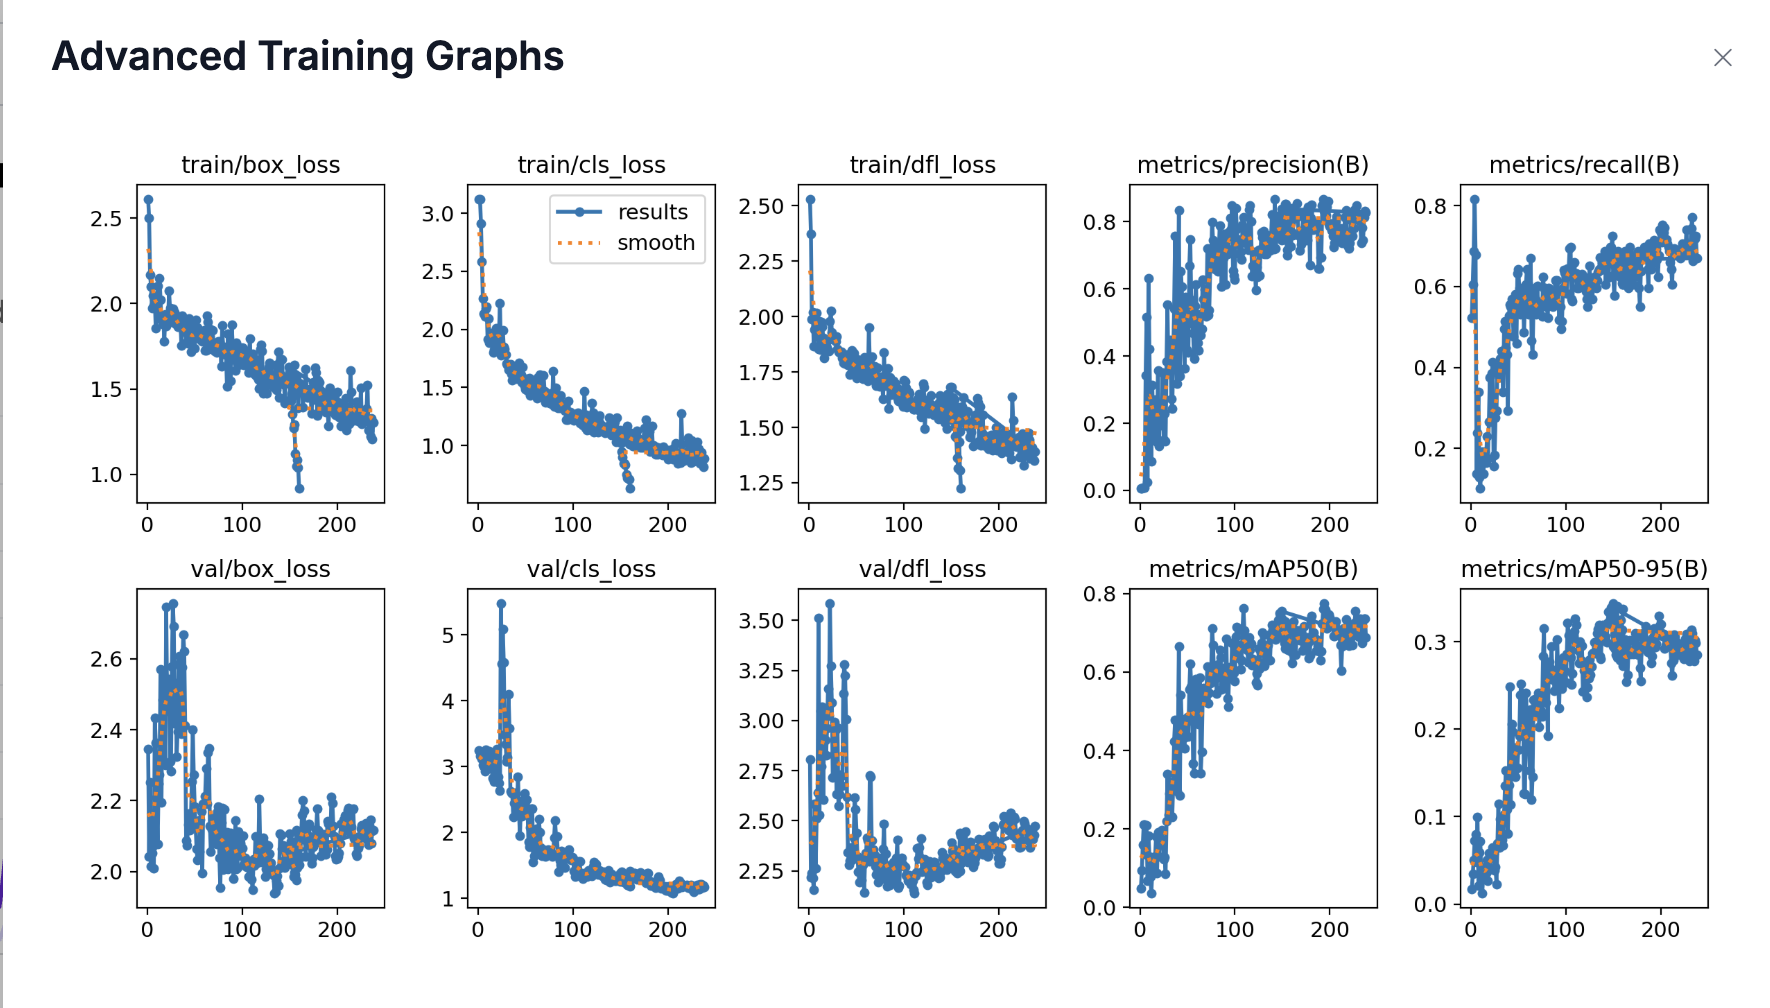
Understanding Metrics — YOLOv11
train/box_loss & val/box_loss
Error lokalisasi bounding box (posisi & ukuran). Turun dari ~2.6 → ~1.2 (train) dan stabil ~2.0 (val) → model makin akurat menempatkan box.
train/cls_loss & val/cls_loss
Error klasifikasi kelas objek. Turun dari ~3.0 → ~1.0 (train) dan ~5+ → ~1.1 (val) → model belajar membedakan hyperbola dari background.
train/dfl_loss & val/dfl_loss
Distribution Focal Loss — loss untuk presisi tepi bounding box (fitur baru YOLOv11). Turun dari ~2.5 → ~1.4 (train) dan stabil ~2.3 (val).
📈 Detection Metrics:
Precision = TP / (TP + FP) — dari semua deteksi yang dibuat model, berapa persen yang benar? High precision = sedikit false positives.
Recall = TP / (TP + FN) — dari semua hyperbola yang ada, berapa persen terdeteksi? High recall = sedikit hyperbola yang terlewat.
mAP@0.5 — mean Average Precision pada IoU threshold 50%. Metric utama object detection.
mAP@0.5:0.95 — rata-rata mAP dari IoU 50% sampai 95% (step 5%). Lebih strict, mengukur kualitas lokalisasi box.
Available Charts & Visualizations
- Advanced Training Graphs - 10 plot: train/val box_loss, cls_loss, dfl_loss, precision, recall, mAP50, mAP50-95
- Confusion Matrix - True/False Positives/Negatives breakdown per class
- Precision-Recall Curve - Trade-off visualization dengan area under curve
- F1 Curve - F1 score vs confidence threshold
Roboflow menggunakan sistem Workflows untuk deploy dan test model secara visual. Workflow mendefinisikan pipeline deteksi dari input image hingga output annotated.
- Setelah training selesai, klik tab "Deploy" di navigation
- Pilih "Deploy your model with Workflows"
- Dialog "Popular Templates" akan muncul dengan pilihan:
- Detect, Count, and Visualize ← pilih ini (default & paling lengkap)
- Detect and Classify
- Small Object Detection (SAHI)
- Text Recognition
- Pilih template "Detect, Count, and Visualize" — workflow otomatis terbentuk dengan nodes:
- Inputs → terima image input
- Object Detection Model (
gpr-liosq-j4vtr/1) → jalankan deteksi - Bounding Box Visualization (
detection_visualization) → gambar bounding boxes - Property Definition (
count_objects) → hitung jumlah deteksi - Label Visualization (
annotated_image) → tambah label teks - Outputs (3 outputs) → kirim hasil
- Di panel kanan, pastikan model gpr-liosq-j4vtr/1 sudah terpilih (status: Selected)
- Klik tombol "Create Workflow"
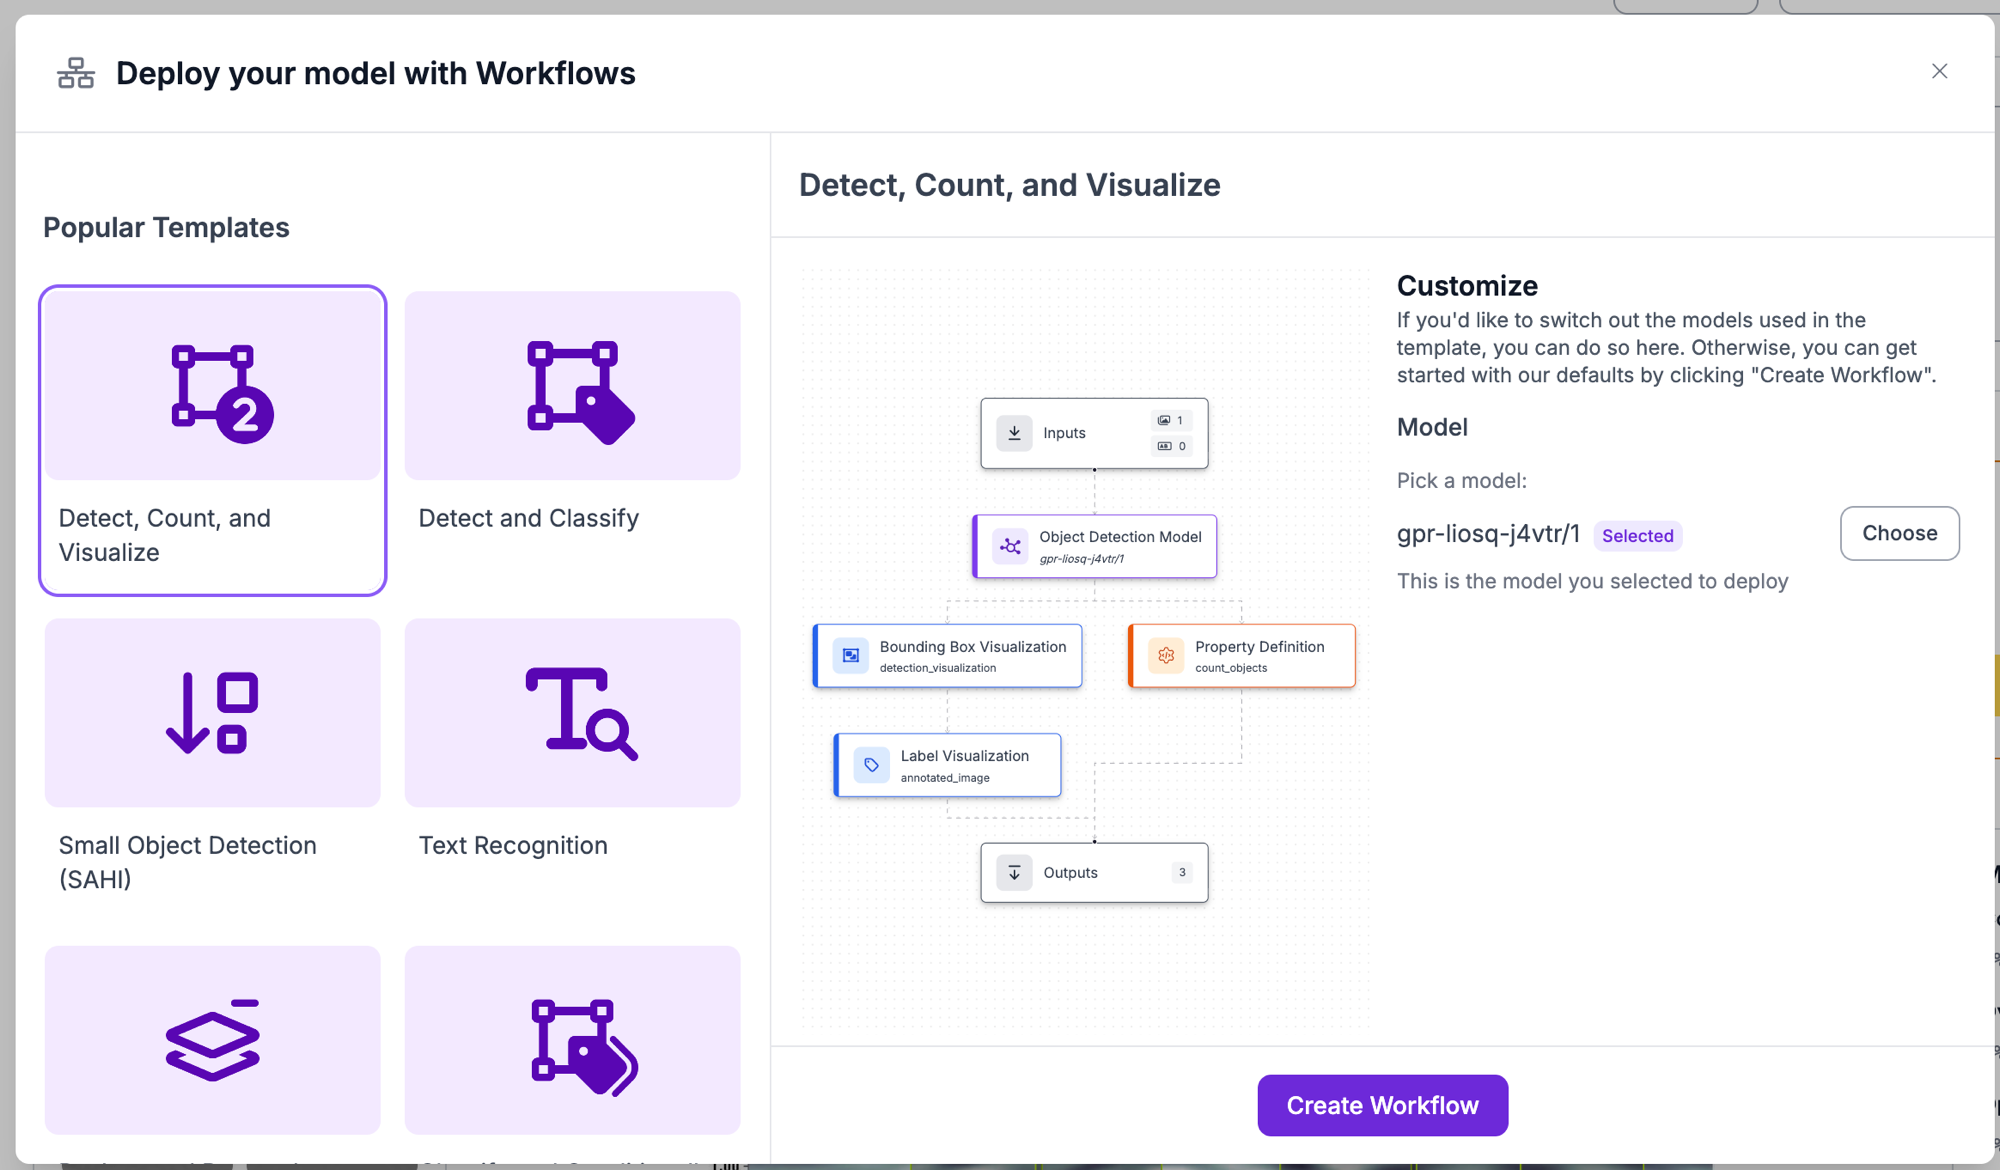
Inputs → Object Detection Model → Bounding Box Visualization + Property Definition → Label Visualization → Outputs
• Model node menjalankan YOLOv11 Nano pada setiap image yang masuk
• Visualization nodes menggambar hasil deteksi (bounding boxes + label) secara otomatis
• count_objects menghitung total hyperbola yang terdeteksi per image
• 3 outputs: annotated image, raw detections (JSON), jumlah objek
1. Buka workflow yang sudah dibuat
2. Klik "Try it" atau "Run" untuk upload test image
3. Drag & drop GPR image ke input node
4. Workflow otomatis memproses dan menampilkan annotated result
5. Review: bounding boxes hyperbola + jumlah deteksi per image
Hasil Inference — "Test Your Workflow"
Setelah workflow berjalan, Roboflow menampilkan dua panel hasil: Visual (radargram dengan bounding box) dan Output (raw JSON detection data).
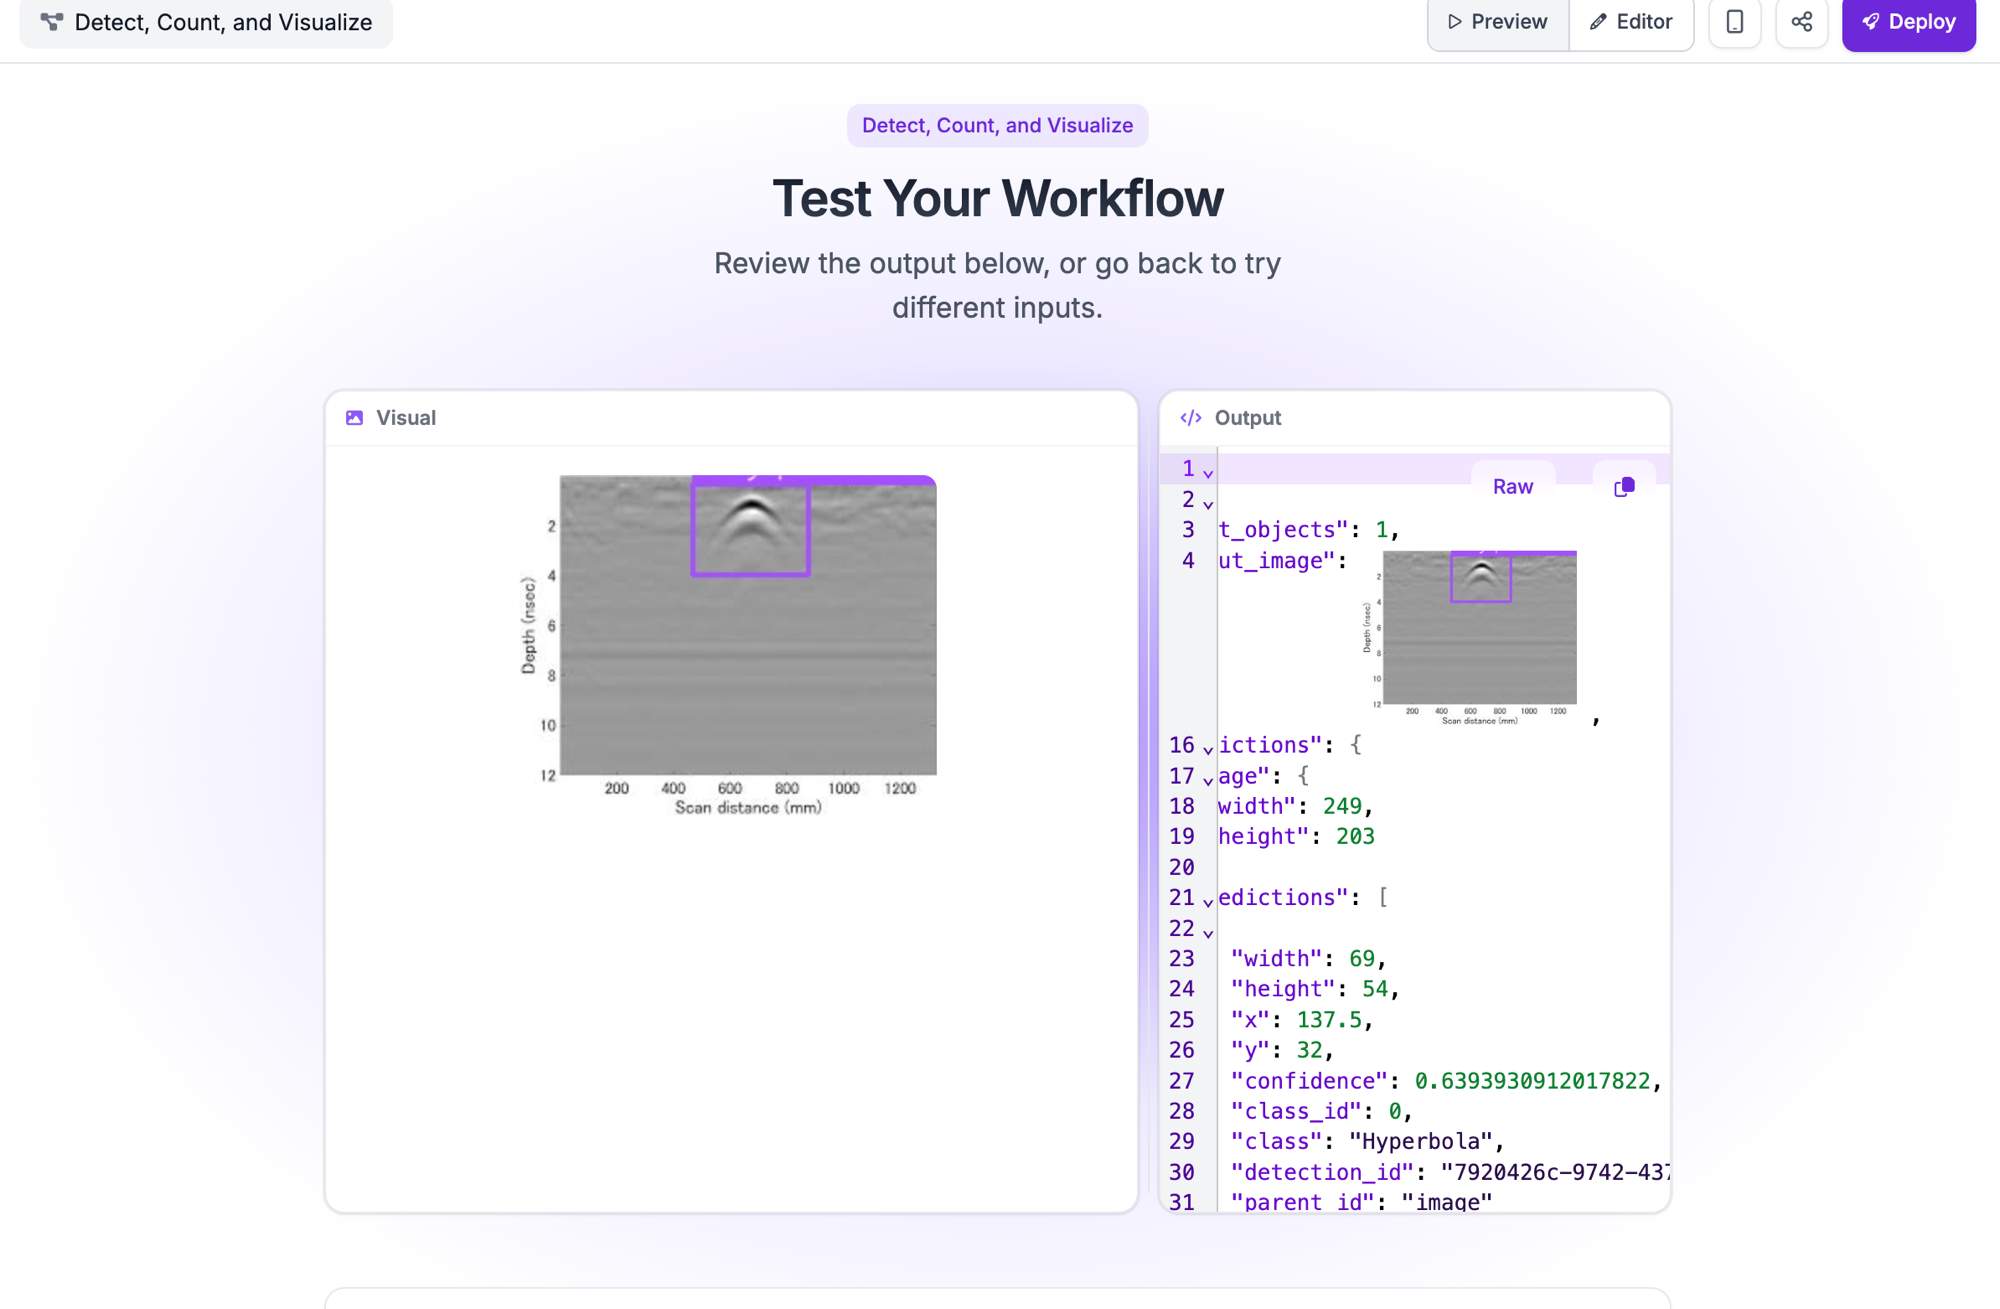
Visual panel: GPR radargram dengan 1 bounding box ungu menandai hyperbola di area shallow (~2–4 nsec)
Output JSON:
"t_objects": 1,
// predictions[0]
"width": 69, "height": 54,
"x": 137.5, "y": 32,
"confidence": 0.639,
"class": "Hyperbola",
"class_id": 0
• 1 hyperbola terdeteksi dengan confidence 63.9%
• Bounding box: lebar 69px × tinggi 54px, center di (137.5, 32)
• Image size: 249 × 203 px
t_objects (count_objects) → jumlah total hyperbola yang terdeteksi
x, y → koordinat center bounding box (pixel)
width, height → ukuran bounding box (pixel)
confidence → skor keyakinan model (0–1), nilai 0.639 = 63.9%
class → nama kelas yang terdeteksi ("Hyperbola")
detection_id → ID unik setiap deteksi untuk tracking
FASE 5: Geophysical Interpretation
Setelah model mendeteksi hyperbola, kita perlu extract informasi geofisika yang berguna dari bounding boxes.
Dari Bounding Box ke Parameter Geofisika
Parameter: Y-coordinate dari bounding box center (apex hyperbola)
Konversi:
• Y-pixel → Two-way travel time (TWTT)
• TWTT → Depth menggunakan velocity
Formula:
Depth (m) = (Velocity × TWTT) / 2
Example:
Apex at y=200 pixels, time scale 0.5 ns/pixel, velocity 0.1 m/ns:
TWTT = 200 × 0.5 = 100 ns
Depth = (0.1 × 100) / 2 = 5 meters
Parameter: Width dari bounding box relatif terhadap depth
Konsep:
• Wide hyperbola → Low velocity material
• Narrow hyperbola → High velocity material
Relationship:
Velocity ∝ 1 / (Hyperbola Width)
Untuk precise velocity: perlu hyperbola fitting algorithm (diffraction curve matching)
Parameter: Amplitude dan width dari hyperbola
Interpretation:
• Large amplitude → Strong contrast (metal pipe, large void)
• Weak amplitude → Subtle contrast (soil boundary, small object)
• Horizontal width → Lateral extent of object
Multiple Hyperbola Analysis
Scenario 1: Vertical alignment
Multiple hyperbolas di x-position sama tapi depth berbeda → Multiple interfaces/layers
Scenario 2: Horizontal pattern
Hyperbolas dengan spacing regular → Buried utility network (pipes, cables)
Scenario 3: Clustered detections
High density hyperbolas di area tertentu → Zone of interest (archaeological site, contaminated zone)
Real-world Applications
💡 Best Practices & Tips
Dataset Quality Checklist
Augmentation Strategy
First iteration: Minimal augmentation (flip horizontal, brightness ±10%)
Evaluate results: If underfitting → add more augmentation
Second iteration: Add rotation ±15°, blur, noise
Avoid: Augmentations yang destroy GPR physics (vertical flip, extreme crops)
Troubleshooting Common Issues
| Problem | Possible Cause | Solution |
|---|---|---|
| Low Precision (<70%) | Too many false positives - model detects noise as hyperbola | • Increase confidence threshold • Add more negative samples (images without hyperbolas) • Review annotation quality |
| Low Recall (<70%) | Missing many hyperbolas | • Decrease confidence threshold • Train for more epochs • Use larger model (Medium instead of Small) • Check if small hyperbolas are annotated |
| Overfitting (high train, low val) | Model memorizing training data | • Add more augmentation • Reduce training epochs • Increase dataset size • Use smaller model |
| Poor performance overall | Dataset quality issues | • Review annotations for errors • Ensure sufficient training data (>100 images) • Check image quality • Verify class balance |
| Training stuck/not converging | Learning rate or model architecture issue | • Try different model (YOLOv11 instead of v8) • Check for data loading errors • Contact Roboflow support if persists |
Model Selection Guide (Quick Reference)
| Use Case | Recommended Model | Rationale |
|---|---|---|
| ✅ Praktikum ini | YOLOv11 Nano | Fast & efficient, cocok untuk learning & dataset kecil |
| Highest accuracy on COCO, sedikit data | Roboflow RF-DETR (Small) | Converges earlier, cocok kalau data terbatas |
| Balance speed & accuracy, production | Roboflow 3.0 (Fast) | YOLOv8-compatible dengan custom enhancements |
| Fastest CPU inference, edge device | YOLO26 (Nano) | NMS-free inference, faster on CPU |
| Small object detection (tiny hyperbolas) | YOLOv11 (Small/Medium) | Upgrade size jika Nano kurang akurat |
🎓 Summary & Next Steps
✓ Computer vision & object detection fundamentals
✓ Ground Penetrating Radar dan hyperbola detection
✓ Roboflow platform - end-to-end no-code workflow
✓ Dataset preprocessing & augmentation strategies
✓ YOLOv11 Nano model training & evaluation (~250 epochs)
✓ Deploy & inference via Roboflow Workflows (Detect, Count, and Visualize)
✓ Geophysical interpretation dari detection results
Langkah Selanjutnya
📖 Referensi
Platform & Documentation
- Roboflow Documentation: https://docs.roboflow.com
- Roboflow Universe: https://universe.roboflow.com
- YOLO Documentation: https://docs.ultralytics.com
GPR & Geophysics
- Jol, H. M. (2008). Ground Penetrating Radar: Theory and Applications. Elsevier.
- Daniels, D. J. (2004). Ground Penetrating Radar (2nd ed.). IET.
- Annan, A. P. (2009). "Electromagnetic Principles of Ground Penetrating Radar." In Ground Penetrating Radar: Theory and Applications.
Deep Learning for GPR
- Jazayeri, S., et al. (2023). "Deep learning for GPR-based utility mapping." Automation in Construction, 145, 104642.
- Kim, N., et al. (2020). "Vision-Based Object Detection and Tracking for Autonomous Navigation of Underwater Robots." Sensors, 20(5), 1588.
- Zhang, Y., et al. (2021). "Automatic detection of underground objects using GPR with deep learning." NDT & E International, 123, 102511.